Macedonian vs Bangladeshi In Labor Force | Age 25-29
COMPARE
Macedonian
Bangladeshi
In Labor Force | Age 25-29
In Labor Force | Age 25-29 Comparison
Macedonians
Bangladeshis
85.7%
IN LABOR FORCE | AGE 25-29
99.9/ 100
METRIC RATING
44th/ 347
METRIC RANK
85.1%
IN LABOR FORCE | AGE 25-29
94.0/ 100
METRIC RATING
99th/ 347
METRIC RANK
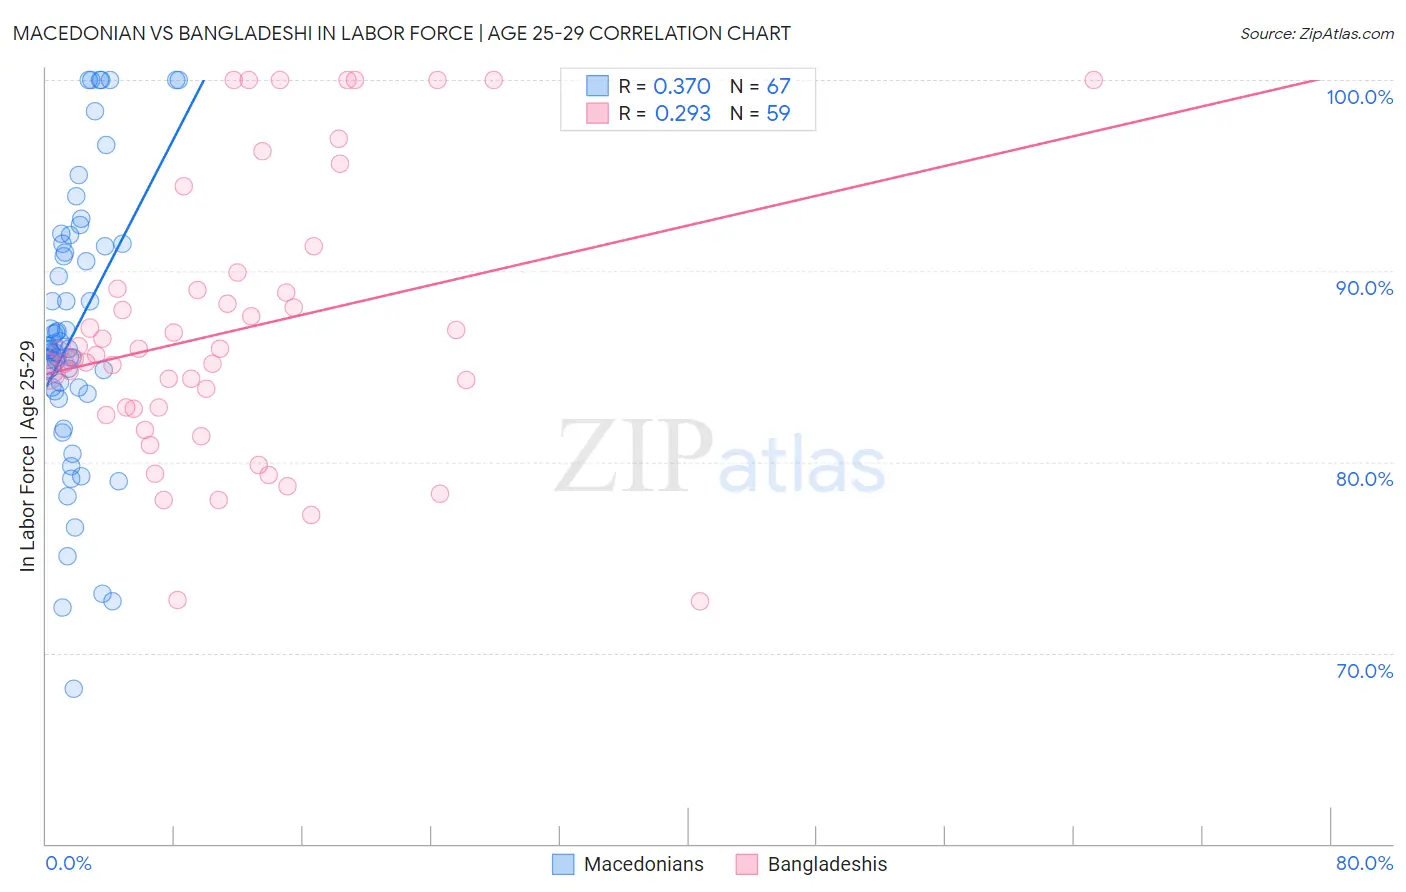
Macedonian vs Bangladeshi In Labor Force | Age 25-29 Correlation Chart
The statistical analysis conducted on geographies consisting of 132,648,005 people shows a mild positive correlation between the proportion of Macedonians and labor force participation rate among population between the ages 25 and 29 in the United States with a correlation coefficient (R) of 0.370 and weighted average of 85.7%. Similarly, the statistical analysis conducted on geographies consisting of 141,437,622 people shows a weak positive correlation between the proportion of Bangladeshis and labor force participation rate among population between the ages 25 and 29 in the United States with a correlation coefficient (R) of 0.293 and weighted average of 85.1%, a difference of 0.70%.
In Labor Force | Age 25-29 Correlation Summary
| Measurement | Macedonian | Bangladeshi |
| Minimum | 68.1% | 72.7% |
| Maximum | 100.0% | 100.0% |
| Range | 31.9% | 27.3% |
| Mean | 86.9% | 86.9% |
| Median | 85.9% | 85.6% |
| Interquartile 25% (IQ1) | 83.7% | 82.8% |
| Interquartile 75% (IQ3) | 91.4% | 89.1% |
| Interquartile Range (IQR) | 7.7% | 6.3% |
| Standard Deviation (Sample) | 7.3% | 7.1% |
| Standard Deviation (Population) | 7.2% | 7.0% |
Similar Demographics by In Labor Force | Age 25-29
Demographics Similar to Macedonians by In Labor Force | Age 25-29
In terms of in labor force | age 25-29, the demographic groups most similar to Macedonians are Immigrants from Sierra Leone (85.7%, a difference of 0.0%), Immigrants from India (85.7%, a difference of 0.010%), Immigrants from Eritrea (85.7%, a difference of 0.020%), Czech (85.6%, a difference of 0.030%), and Immigrants from Greece (85.7%, a difference of 0.060%).
| Demographics | Rating | Rank | In Labor Force | Age 25-29 |
| Poles | 99.9 /100 | #37 | Exceptional 85.8% |
| Sierra Leoneans | 99.9 /100 | #38 | Exceptional 85.8% |
| Croatians | 99.9 /100 | #39 | Exceptional 85.8% |
| Immigrants | Albania | 99.9 /100 | #40 | Exceptional 85.7% |
| Immigrants | Greece | 99.9 /100 | #41 | Exceptional 85.7% |
| Immigrants | Eritrea | 99.9 /100 | #42 | Exceptional 85.7% |
| Immigrants | India | 99.9 /100 | #43 | Exceptional 85.7% |
| Macedonians | 99.9 /100 | #44 | Exceptional 85.7% |
| Immigrants | Sierra Leone | 99.9 /100 | #45 | Exceptional 85.7% |
| Czechs | 99.8 /100 | #46 | Exceptional 85.6% |
| Turks | 99.8 /100 | #47 | Exceptional 85.6% |
| Italians | 99.8 /100 | #48 | Exceptional 85.6% |
| Swedes | 99.8 /100 | #49 | Exceptional 85.6% |
| Yugoslavians | 99.8 /100 | #50 | Exceptional 85.6% |
| Immigrants | Latvia | 99.8 /100 | #51 | Exceptional 85.6% |
Demographics Similar to Bangladeshis by In Labor Force | Age 25-29
In terms of in labor force | age 25-29, the demographic groups most similar to Bangladeshis are Mongolian (85.1%, a difference of 0.0%), Immigrants from Switzerland (85.1%, a difference of 0.0%), Immigrants from Sudan (85.1%, a difference of 0.010%), Egyptian (85.1%, a difference of 0.010%), and Slavic (85.1%, a difference of 0.010%).
| Demographics | Rating | Rank | In Labor Force | Age 25-29 |
| Immigrants | Costa Rica | 95.5 /100 | #92 | Exceptional 85.1% |
| Austrians | 95.3 /100 | #93 | Exceptional 85.1% |
| Immigrants | Korea | 94.8 /100 | #94 | Exceptional 85.1% |
| Immigrants | Netherlands | 94.6 /100 | #95 | Exceptional 85.1% |
| Immigrants | Romania | 94.6 /100 | #96 | Exceptional 85.1% |
| Immigrants | Sudan | 94.3 /100 | #97 | Exceptional 85.1% |
| Mongolians | 94.1 /100 | #98 | Exceptional 85.1% |
| Bangladeshis | 94.0 /100 | #99 | Exceptional 85.1% |
| Immigrants | Switzerland | 93.9 /100 | #100 | Exceptional 85.1% |
| Egyptians | 93.8 /100 | #101 | Exceptional 85.1% |
| Slavs | 93.7 /100 | #102 | Exceptional 85.1% |
| Immigrants | Japan | 93.5 /100 | #103 | Exceptional 85.1% |
| Immigrants | Zaire | 93.3 /100 | #104 | Exceptional 85.1% |
| Immigrants | Hong Kong | 92.8 /100 | #105 | Exceptional 85.0% |
| Czechoslovakians | 92.6 /100 | #106 | Exceptional 85.0% |