Lumbee vs Immigrants from Romania In Labor Force | Age 20-64
COMPARE
Lumbee
Immigrants from Romania
In Labor Force | Age 20-64
In Labor Force | Age 20-64 Comparison
Lumbee
Immigrants from Romania
70.6%
IN LABOR FORCE | AGE 20-64
0.0/ 100
METRIC RATING
344th/ 347
METRIC RANK
80.2%
IN LABOR FORCE | AGE 20-64
97.8/ 100
METRIC RATING
78th/ 347
METRIC RANK
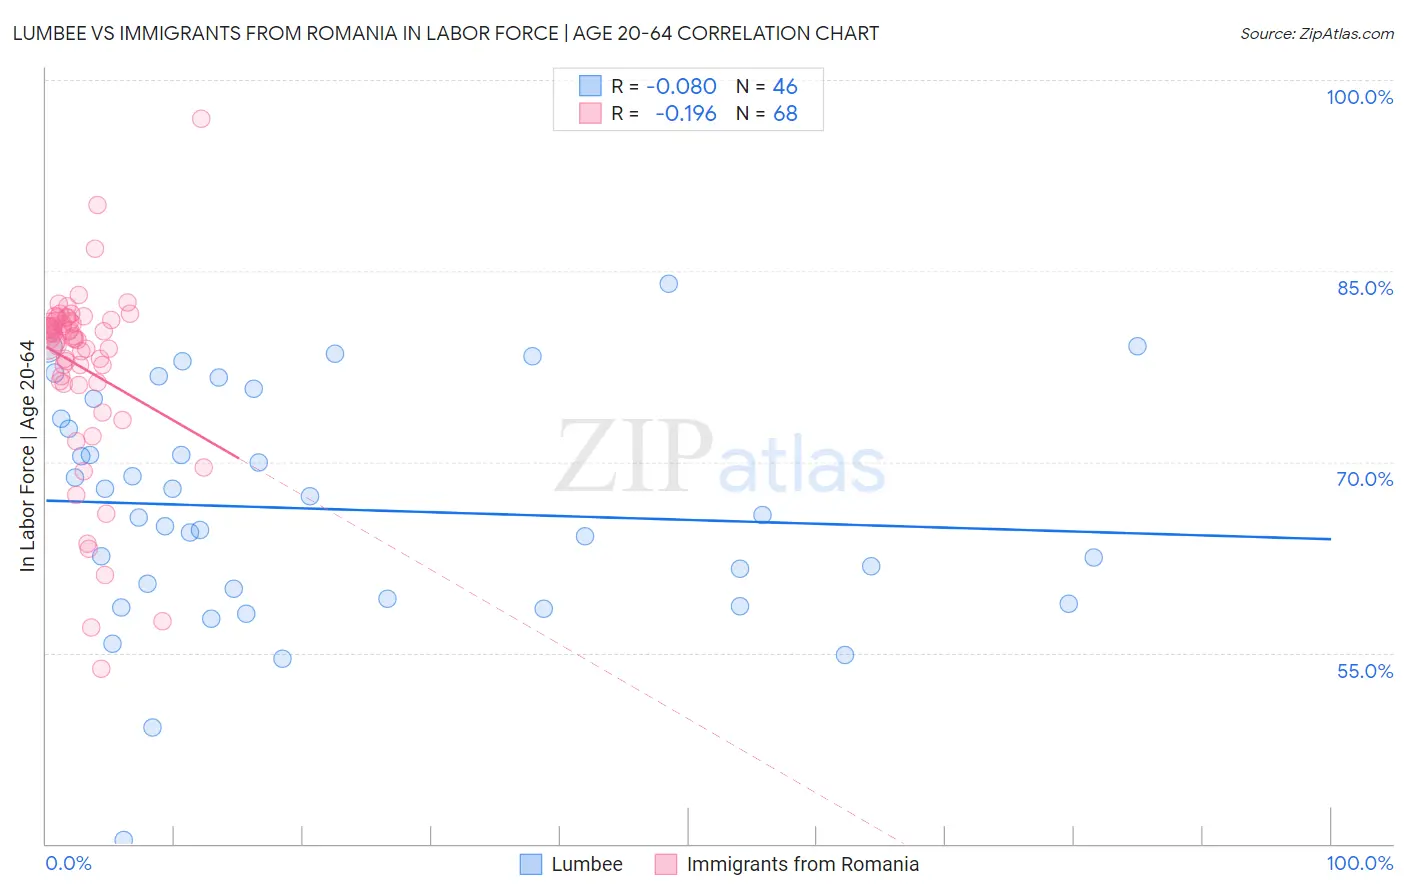
Lumbee vs Immigrants from Romania In Labor Force | Age 20-64 Correlation Chart
The statistical analysis conducted on geographies consisting of 92,293,168 people shows a slight negative correlation between the proportion of Lumbee and labor force participation rate among population between the ages 20 and 64 in the United States with a correlation coefficient (R) of -0.080 and weighted average of 70.6%. Similarly, the statistical analysis conducted on geographies consisting of 257,013,764 people shows a poor negative correlation between the proportion of Immigrants from Romania and labor force participation rate among population between the ages 20 and 64 in the United States with a correlation coefficient (R) of -0.196 and weighted average of 80.2%, a difference of 13.5%.
In Labor Force | Age 20-64 Correlation Summary
| Measurement | Lumbee | Immigrants from Romania |
| Minimum | 40.3% | 53.7% |
| Maximum | 84.0% | 97.0% |
| Range | 43.7% | 43.3% |
| Mean | 66.3% | 77.4% |
| Median | 65.7% | 79.7% |
| Interquartile 25% (IQ1) | 59.2% | 76.3% |
| Interquartile 75% (IQ3) | 73.4% | 81.0% |
| Interquartile Range (IQR) | 14.2% | 4.8% |
| Standard Deviation (Sample) | 9.0% | 7.3% |
| Standard Deviation (Population) | 8.9% | 7.3% |
Similar Demographics by In Labor Force | Age 20-64
Demographics Similar to Lumbee by In Labor Force | Age 20-64
In terms of in labor force | age 20-64, the demographic groups most similar to Lumbee are Tohono O'odham (70.4%, a difference of 0.33%), Hopi (71.7%, a difference of 1.5%), Yuman (71.7%, a difference of 1.5%), Navajo (69.2%, a difference of 2.1%), and Pima (69.0%, a difference of 2.3%).
| Demographics | Rating | Rank | In Labor Force | Age 20-64 |
| Natives/Alaskans | 0.0 /100 | #333 | Tragic 73.9% |
| Apache | 0.0 /100 | #334 | Tragic 73.7% |
| Ute | 0.0 /100 | #335 | Tragic 73.7% |
| Crow | 0.0 /100 | #336 | Tragic 73.3% |
| Yup'ik | 0.0 /100 | #337 | Tragic 73.2% |
| Puerto Ricans | 0.0 /100 | #338 | Tragic 73.1% |
| Houma | 0.0 /100 | #339 | Tragic 72.7% |
| Pueblo | 0.0 /100 | #340 | Tragic 72.6% |
| Immigrants | Yemen | 0.0 /100 | #341 | Tragic 72.3% |
| Yuman | 0.0 /100 | #342 | Tragic 71.7% |
| Hopi | 0.0 /100 | #343 | Tragic 71.7% |
| Lumbee | 0.0 /100 | #344 | Tragic 70.6% |
| Tohono O'odham | 0.0 /100 | #345 | Tragic 70.4% |
| Navajo | 0.0 /100 | #346 | Tragic 69.2% |
| Pima | 0.0 /100 | #347 | Tragic 69.0% |
Demographics Similar to Immigrants from Romania by In Labor Force | Age 20-64
In terms of in labor force | age 20-64, the demographic groups most similar to Immigrants from Romania are Egyptian (80.2%, a difference of 0.0%), Immigrants from Colombia (80.2%, a difference of 0.0%), Immigrants from Afghanistan (80.2%, a difference of 0.010%), Asian (80.2%, a difference of 0.010%), and Immigrants from Croatia (80.1%, a difference of 0.020%).
| Demographics | Rating | Rank | In Labor Force | Age 20-64 |
| Soviet Union | 98.5 /100 | #71 | Exceptional 80.2% |
| Eastern Europeans | 98.4 /100 | #72 | Exceptional 80.2% |
| Cypriots | 98.2 /100 | #73 | Exceptional 80.2% |
| Immigrants | Eastern Europe | 98.1 /100 | #74 | Exceptional 80.2% |
| Immigrants | Afghanistan | 97.9 /100 | #75 | Exceptional 80.2% |
| Egyptians | 97.8 /100 | #76 | Exceptional 80.2% |
| Immigrants | Colombia | 97.8 /100 | #77 | Exceptional 80.2% |
| Immigrants | Romania | 97.8 /100 | #78 | Exceptional 80.2% |
| Asians | 97.7 /100 | #79 | Exceptional 80.2% |
| Immigrants | Croatia | 97.6 /100 | #80 | Exceptional 80.1% |
| German Russians | 97.3 /100 | #81 | Exceptional 80.1% |
| Immigrants | Japan | 97.3 /100 | #82 | Exceptional 80.1% |
| Colombians | 97.3 /100 | #83 | Exceptional 80.1% |
| Immigrants | Latvia | 97.2 /100 | #84 | Exceptional 80.1% |
| Jordanians | 97.2 /100 | #85 | Exceptional 80.1% |