Chilean vs Immigrants from Netherlands In Labor Force | Age 30-34
COMPARE
Chilean
Immigrants from Netherlands
In Labor Force | Age 30-34
In Labor Force | Age 30-34 Comparison
Chileans
Immigrants from Netherlands
84.9%
IN LABOR FORCE | AGE 30-34
85.3/ 100
METRIC RATING
141st/ 347
METRIC RANK
84.6%
IN LABOR FORCE | AGE 30-34
42.1/ 100
METRIC RATING
180th/ 347
METRIC RANK
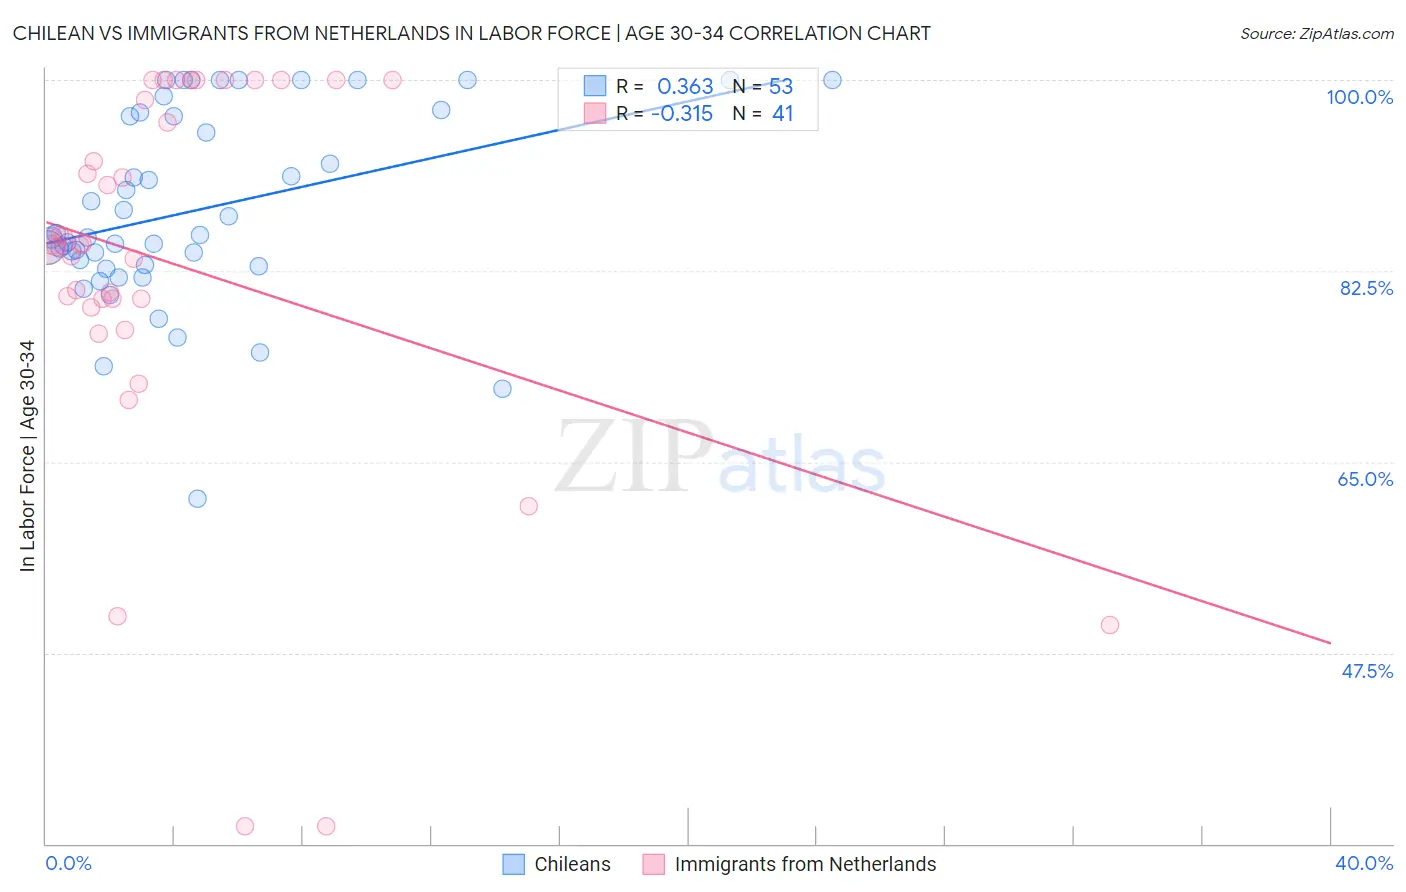
Chilean vs Immigrants from Netherlands In Labor Force | Age 30-34 Correlation Chart
The statistical analysis conducted on geographies consisting of 256,589,082 people shows a mild positive correlation between the proportion of Chileans and labor force participation rate among population between the ages 30 and 34 in the United States with a correlation coefficient (R) of 0.363 and weighted average of 84.9%. Similarly, the statistical analysis conducted on geographies consisting of 237,758,588 people shows a mild negative correlation between the proportion of Immigrants from Netherlands and labor force participation rate among population between the ages 30 and 34 in the United States with a correlation coefficient (R) of -0.315 and weighted average of 84.6%, a difference of 0.37%.
In Labor Force | Age 30-34 Correlation Summary
| Measurement | Chilean | Immigrants from Netherlands |
| Minimum | 61.6% | 31.6% |
| Maximum | 100.0% | 100.0% |
| Range | 38.4% | 68.4% |
| Mean | 88.0% | 83.0% |
| Median | 85.6% | 84.9% |
| Interquartile 25% (IQ1) | 83.0% | 79.5% |
| Interquartile 75% (IQ3) | 96.8% | 99.1% |
| Interquartile Range (IQR) | 13.8% | 19.5% |
| Standard Deviation (Sample) | 8.8% | 17.2% |
| Standard Deviation (Population) | 8.7% | 17.0% |
Similar Demographics by In Labor Force | Age 30-34
Demographics Similar to Chileans by In Labor Force | Age 30-34
In terms of in labor force | age 30-34, the demographic groups most similar to Chileans are Immigrants from Indonesia (84.9%, a difference of 0.010%), Immigrants from Vietnam (85.0%, a difference of 0.020%), Bhutanese (85.0%, a difference of 0.030%), South African (85.0%, a difference of 0.040%), and Sri Lankan (85.0%, a difference of 0.040%).
| Demographics | Rating | Rank | In Labor Force | Age 30-34 |
| Immigrants | Chile | 89.2 /100 | #134 | Excellent 85.0% |
| Immigrants | Asia | 88.9 /100 | #135 | Excellent 85.0% |
| Jordanians | 88.6 /100 | #136 | Excellent 85.0% |
| South Africans | 88.0 /100 | #137 | Excellent 85.0% |
| Sri Lankans | 87.8 /100 | #138 | Excellent 85.0% |
| Bhutanese | 87.5 /100 | #139 | Excellent 85.0% |
| Immigrants | Vietnam | 86.5 /100 | #140 | Excellent 85.0% |
| Chileans | 85.3 /100 | #141 | Excellent 84.9% |
| Immigrants | Indonesia | 84.3 /100 | #142 | Excellent 84.9% |
| Colombians | 82.2 /100 | #143 | Excellent 84.9% |
| Uruguayans | 78.5 /100 | #144 | Good 84.9% |
| Palestinians | 77.7 /100 | #145 | Good 84.9% |
| Immigrants | Saudi Arabia | 76.6 /100 | #146 | Good 84.9% |
| Immigrants | Colombia | 76.3 /100 | #147 | Good 84.9% |
| Immigrants | Pakistan | 76.2 /100 | #148 | Good 84.9% |
Demographics Similar to Immigrants from Netherlands by In Labor Force | Age 30-34
In terms of in labor force | age 30-34, the demographic groups most similar to Immigrants from Netherlands are Immigrants from Nigeria (84.6%, a difference of 0.0%), Okinawan (84.6%, a difference of 0.010%), Moroccan (84.6%, a difference of 0.010%), Laotian (84.7%, a difference of 0.030%), and Barbadian (84.6%, a difference of 0.040%).
| Demographics | Rating | Rank | In Labor Force | Age 30-34 |
| Israelis | 51.1 /100 | #173 | Average 84.7% |
| Finns | 50.0 /100 | #174 | Average 84.7% |
| Immigrants | South America | 50.0 /100 | #175 | Average 84.7% |
| Immigrants | Uzbekistan | 49.1 /100 | #176 | Average 84.7% |
| Laotians | 46.9 /100 | #177 | Average 84.7% |
| Okinawans | 44.1 /100 | #178 | Average 84.6% |
| Immigrants | Nigeria | 42.5 /100 | #179 | Average 84.6% |
| Immigrants | Netherlands | 42.1 /100 | #180 | Average 84.6% |
| Moroccans | 40.3 /100 | #181 | Average 84.6% |
| Barbadians | 36.7 /100 | #182 | Fair 84.6% |
| Immigrants | Canada | 35.0 /100 | #183 | Fair 84.6% |
| Immigrants | North America | 33.3 /100 | #184 | Fair 84.6% |
| Immigrants | Philippines | 31.5 /100 | #185 | Fair 84.6% |
| Immigrants | Congo | 29.7 /100 | #186 | Fair 84.6% |
| Costa Ricans | 29.6 /100 | #187 | Fair 84.6% |