Immigrants from Guyana vs Iranian In Labor Force | Age 25-29
COMPARE
Immigrants from Guyana
Iranian
In Labor Force | Age 25-29
In Labor Force | Age 25-29 Comparison
Immigrants from Guyana
Iranians
83.0%
IN LABOR FORCE | AGE 25-29
0.0/ 100
METRIC RATING
292nd/ 347
METRIC RANK
84.8%
IN LABOR FORCE | AGE 25-29
78.1/ 100
METRIC RATING
131st/ 347
METRIC RANK
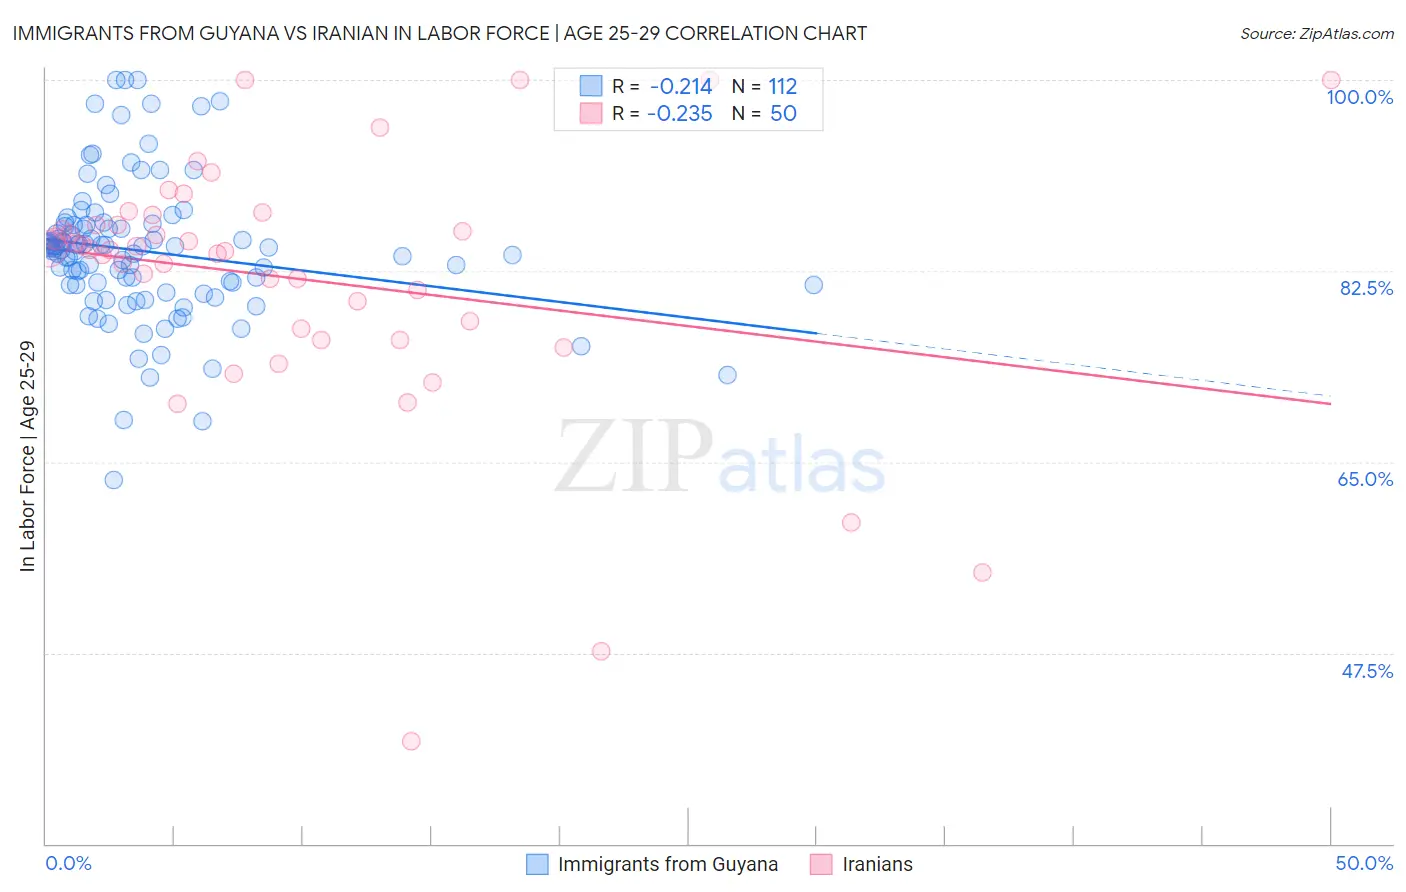
Immigrants from Guyana vs Iranian In Labor Force | Age 25-29 Correlation Chart
The statistical analysis conducted on geographies consisting of 183,703,762 people shows a weak negative correlation between the proportion of Immigrants from Guyana and labor force participation rate among population between the ages 25 and 29 in the United States with a correlation coefficient (R) of -0.214 and weighted average of 83.0%. Similarly, the statistical analysis conducted on geographies consisting of 316,808,668 people shows a weak negative correlation between the proportion of Iranians and labor force participation rate among population between the ages 25 and 29 in the United States with a correlation coefficient (R) of -0.235 and weighted average of 84.8%, a difference of 2.3%.
In Labor Force | Age 25-29 Correlation Summary
| Measurement | Immigrants from Guyana | Iranian |
| Minimum | 63.4% | 39.4% |
| Maximum | 100.0% | 100.0% |
| Range | 36.6% | 60.6% |
| Mean | 84.3% | 81.8% |
| Median | 84.6% | 84.5% |
| Interquartile 25% (IQ1) | 81.2% | 77.2% |
| Interquartile 75% (IQ3) | 86.7% | 86.7% |
| Interquartile Range (IQR) | 5.5% | 9.6% |
| Standard Deviation (Sample) | 6.4% | 11.9% |
| Standard Deviation (Population) | 6.4% | 11.8% |
Similar Demographics by In Labor Force | Age 25-29
Demographics Similar to Immigrants from Guyana by In Labor Force | Age 25-29
In terms of in labor force | age 25-29, the demographic groups most similar to Immigrants from Guyana are Immigrants from Bangladesh (83.0%, a difference of 0.020%), Hawaiian (83.0%, a difference of 0.020%), Immigrants from Latin America (82.9%, a difference of 0.030%), Nepalese (82.9%, a difference of 0.040%), and Chippewa (82.9%, a difference of 0.040%).
| Demographics | Rating | Rank | In Labor Force | Age 25-29 |
| Belizeans | 0.0 /100 | #285 | Tragic 83.1% |
| Mexican American Indians | 0.0 /100 | #286 | Tragic 83.0% |
| Guyanese | 0.0 /100 | #287 | Tragic 83.0% |
| Ottawa | 0.0 /100 | #288 | Tragic 83.0% |
| Immigrants | Micronesia | 0.0 /100 | #289 | Tragic 83.0% |
| Immigrants | Bangladesh | 0.0 /100 | #290 | Tragic 83.0% |
| Hawaiians | 0.0 /100 | #291 | Tragic 83.0% |
| Immigrants | Guyana | 0.0 /100 | #292 | Tragic 83.0% |
| Immigrants | Latin America | 0.0 /100 | #293 | Tragic 82.9% |
| Nepalese | 0.0 /100 | #294 | Tragic 82.9% |
| Chippewa | 0.0 /100 | #295 | Tragic 82.9% |
| Immigrants | Nicaragua | 0.0 /100 | #296 | Tragic 82.9% |
| Potawatomi | 0.0 /100 | #297 | Tragic 82.9% |
| Native Hawaiians | 0.0 /100 | #298 | Tragic 82.9% |
| Fijians | 0.0 /100 | #299 | Tragic 82.9% |
Demographics Similar to Iranians by In Labor Force | Age 25-29
In terms of in labor force | age 25-29, the demographic groups most similar to Iranians are Romanian (84.8%, a difference of 0.0%), Asian (84.8%, a difference of 0.0%), Syrian (84.8%, a difference of 0.020%), Immigrants from Hungary (84.8%, a difference of 0.020%), and Bhutanese (84.8%, a difference of 0.020%).
| Demographics | Rating | Rank | In Labor Force | Age 25-29 |
| Immigrants | Iran | 84.8 /100 | #124 | Excellent 84.9% |
| Uruguayans | 84.7 /100 | #125 | Excellent 84.9% |
| Immigrants | Singapore | 84.4 /100 | #126 | Excellent 84.9% |
| Immigrants | Uruguay | 84.0 /100 | #127 | Excellent 84.9% |
| Australians | 83.6 /100 | #128 | Excellent 84.9% |
| Immigrants | Russia | 81.6 /100 | #129 | Excellent 84.9% |
| Northern Europeans | 81.3 /100 | #130 | Excellent 84.9% |
| Iranians | 78.1 /100 | #131 | Good 84.8% |
| Romanians | 77.7 /100 | #132 | Good 84.8% |
| Asians | 77.7 /100 | #133 | Good 84.8% |
| Syrians | 76.5 /100 | #134 | Good 84.8% |
| Immigrants | Hungary | 76.4 /100 | #135 | Good 84.8% |
| Bhutanese | 76.0 /100 | #136 | Good 84.8% |
| Immigrants | Canada | 73.5 /100 | #137 | Good 84.8% |
| Armenians | 72.7 /100 | #138 | Good 84.8% |