Cambodian vs Iranian In Labor Force | Age 25-29
COMPARE
Cambodian
Iranian
In Labor Force | Age 25-29
In Labor Force | Age 25-29 Comparison
Cambodians
Iranians
86.0%
IN LABOR FORCE | AGE 25-29
100.0/ 100
METRIC RATING
22nd/ 347
METRIC RANK
84.8%
IN LABOR FORCE | AGE 25-29
78.1/ 100
METRIC RATING
131st/ 347
METRIC RANK
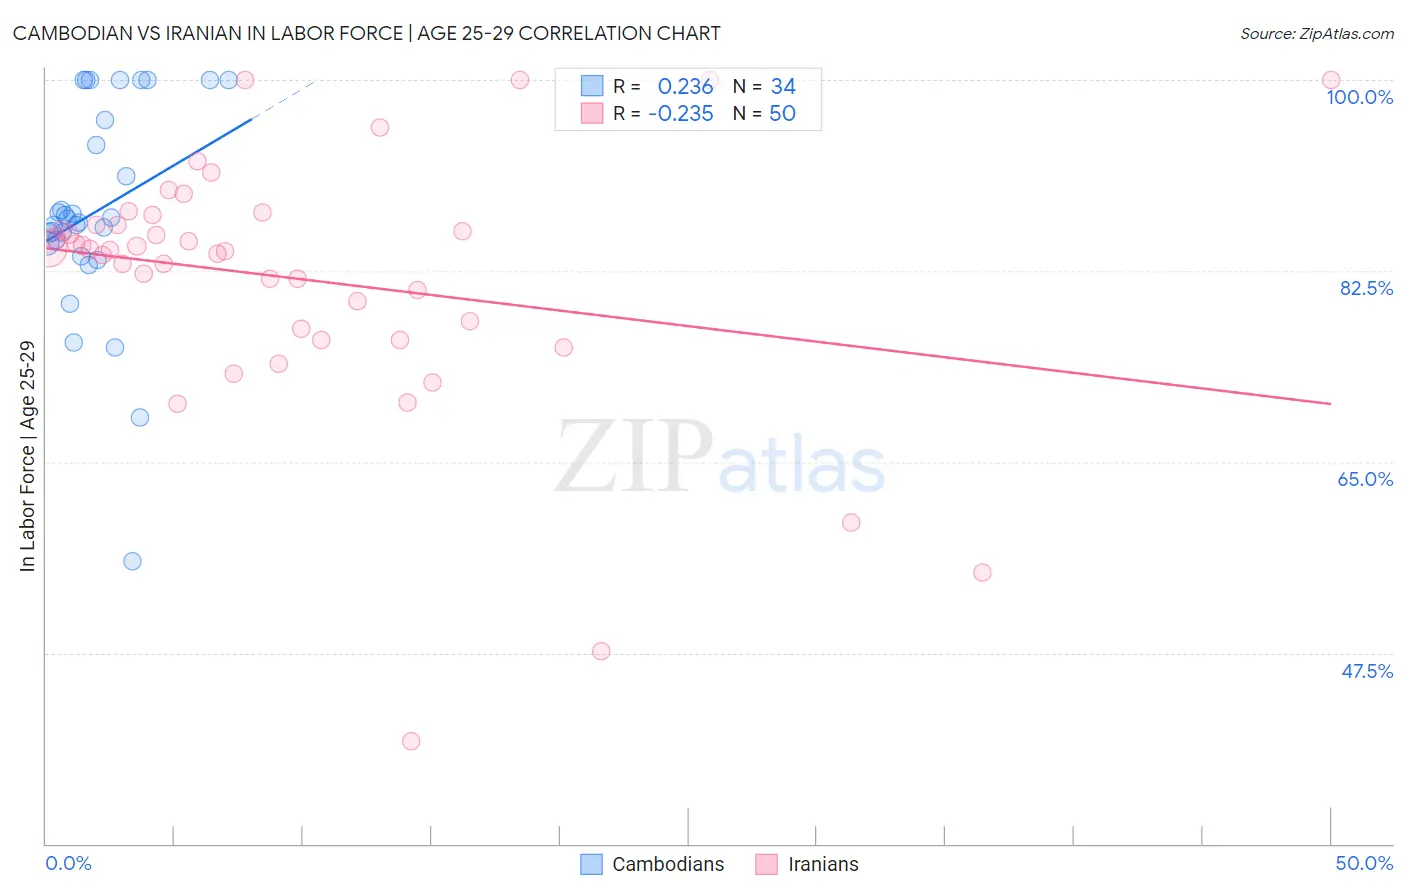
Cambodian vs Iranian In Labor Force | Age 25-29 Correlation Chart
The statistical analysis conducted on geographies consisting of 102,510,080 people shows a weak positive correlation between the proportion of Cambodians and labor force participation rate among population between the ages 25 and 29 in the United States with a correlation coefficient (R) of 0.236 and weighted average of 86.0%. Similarly, the statistical analysis conducted on geographies consisting of 316,808,668 people shows a weak negative correlation between the proportion of Iranians and labor force participation rate among population between the ages 25 and 29 in the United States with a correlation coefficient (R) of -0.235 and weighted average of 84.8%, a difference of 1.3%.
In Labor Force | Age 25-29 Correlation Summary
| Measurement | Cambodian | Iranian |
| Minimum | 55.9% | 39.4% |
| Maximum | 100.0% | 100.0% |
| Range | 44.1% | 60.6% |
| Mean | 87.9% | 81.8% |
| Median | 87.1% | 84.5% |
| Interquartile 25% (IQ1) | 85.0% | 77.2% |
| Interquartile 75% (IQ3) | 96.4% | 86.7% |
| Interquartile Range (IQR) | 11.3% | 9.6% |
| Standard Deviation (Sample) | 9.7% | 11.9% |
| Standard Deviation (Population) | 9.6% | 11.8% |
Similar Demographics by In Labor Force | Age 25-29
Demographics Similar to Cambodians by In Labor Force | Age 25-29
In terms of in labor force | age 25-29, the demographic groups most similar to Cambodians are Maltese (86.0%, a difference of 0.010%), Immigrants from Ireland (86.0%, a difference of 0.020%), Immigrants from Uganda (86.0%, a difference of 0.020%), Immigrants from Eastern Africa (86.0%, a difference of 0.030%), and Bulgarian (86.0%, a difference of 0.040%).
| Demographics | Rating | Rank | In Labor Force | Age 25-29 |
| Bolivians | 100.0 /100 | #15 | Exceptional 86.1% |
| Immigrants | Bolivia | 100.0 /100 | #16 | Exceptional 86.1% |
| Bermudans | 100.0 /100 | #17 | Exceptional 86.0% |
| Bulgarians | 100.0 /100 | #18 | Exceptional 86.0% |
| Cape Verdeans | 100.0 /100 | #19 | Exceptional 86.0% |
| Immigrants | Ireland | 100.0 /100 | #20 | Exceptional 86.0% |
| Maltese | 100.0 /100 | #21 | Exceptional 86.0% |
| Cambodians | 100.0 /100 | #22 | Exceptional 86.0% |
| Immigrants | Uganda | 100.0 /100 | #23 | Exceptional 86.0% |
| Immigrants | Eastern Africa | 100.0 /100 | #24 | Exceptional 86.0% |
| Sudanese | 100.0 /100 | #25 | Exceptional 85.9% |
| Immigrants | North Macedonia | 100.0 /100 | #26 | Exceptional 85.9% |
| Paraguayans | 100.0 /100 | #27 | Exceptional 85.9% |
| Ugandans | 100.0 /100 | #28 | Exceptional 85.9% |
| Immigrants | Liberia | 100.0 /100 | #29 | Exceptional 85.9% |
Demographics Similar to Iranians by In Labor Force | Age 25-29
In terms of in labor force | age 25-29, the demographic groups most similar to Iranians are Romanian (84.8%, a difference of 0.0%), Asian (84.8%, a difference of 0.0%), Syrian (84.8%, a difference of 0.020%), Immigrants from Hungary (84.8%, a difference of 0.020%), and Bhutanese (84.8%, a difference of 0.020%).
| Demographics | Rating | Rank | In Labor Force | Age 25-29 |
| Immigrants | Iran | 84.8 /100 | #124 | Excellent 84.9% |
| Uruguayans | 84.7 /100 | #125 | Excellent 84.9% |
| Immigrants | Singapore | 84.4 /100 | #126 | Excellent 84.9% |
| Immigrants | Uruguay | 84.0 /100 | #127 | Excellent 84.9% |
| Australians | 83.6 /100 | #128 | Excellent 84.9% |
| Immigrants | Russia | 81.6 /100 | #129 | Excellent 84.9% |
| Northern Europeans | 81.3 /100 | #130 | Excellent 84.9% |
| Iranians | 78.1 /100 | #131 | Good 84.8% |
| Romanians | 77.7 /100 | #132 | Good 84.8% |
| Asians | 77.7 /100 | #133 | Good 84.8% |
| Syrians | 76.5 /100 | #134 | Good 84.8% |
| Immigrants | Hungary | 76.4 /100 | #135 | Good 84.8% |
| Bhutanese | 76.0 /100 | #136 | Good 84.8% |
| Immigrants | Canada | 73.5 /100 | #137 | Good 84.8% |
| Armenians | 72.7 /100 | #138 | Good 84.8% |