Korean vs Immigrants from Nigeria In Labor Force | Age 20-64
COMPARE
Korean
Immigrants from Nigeria
In Labor Force | Age 20-64
In Labor Force | Age 20-64 Comparison
Koreans
Immigrants from Nigeria
79.8%
IN LABOR FORCE | AGE 20-64
79.6/ 100
METRIC RATING
144th/ 347
METRIC RANK
79.9%
IN LABOR FORCE | AGE 20-64
86.4/ 100
METRIC RATING
138th/ 347
METRIC RANK
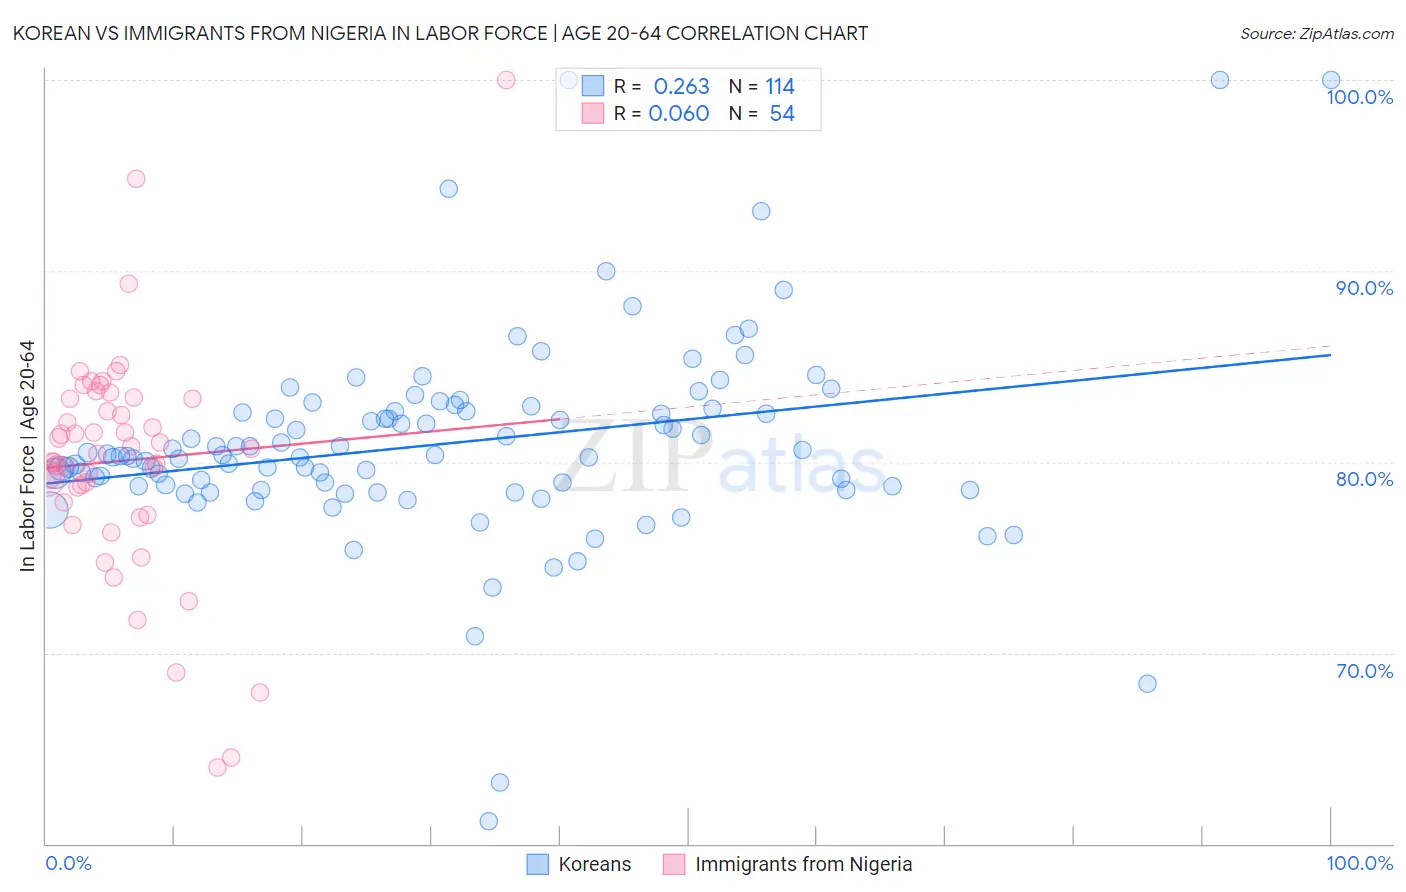
Korean vs Immigrants from Nigeria In Labor Force | Age 20-64 Correlation Chart
The statistical analysis conducted on geographies consisting of 510,967,467 people shows a weak positive correlation between the proportion of Koreans and labor force participation rate among population between the ages 20 and 64 in the United States with a correlation coefficient (R) of 0.263 and weighted average of 79.8%. Similarly, the statistical analysis conducted on geographies consisting of 283,492,708 people shows a slight positive correlation between the proportion of Immigrants from Nigeria and labor force participation rate among population between the ages 20 and 64 in the United States with a correlation coefficient (R) of 0.060 and weighted average of 79.9%, a difference of 0.10%.
In Labor Force | Age 20-64 Correlation Summary
| Measurement | Korean | Immigrants from Nigeria |
| Minimum | 61.2% | 64.0% |
| Maximum | 100.0% | 100.0% |
| Range | 38.8% | 36.0% |
| Mean | 81.0% | 80.1% |
| Median | 80.3% | 80.6% |
| Interquartile 25% (IQ1) | 78.7% | 77.9% |
| Interquartile 75% (IQ3) | 82.7% | 83.3% |
| Interquartile Range (IQR) | 4.0% | 5.4% |
| Standard Deviation (Sample) | 5.4% | 6.1% |
| Standard Deviation (Population) | 5.4% | 6.0% |
Demographics Similar to Koreans and Immigrants from Nigeria by In Labor Force | Age 20-64
In terms of in labor force | age 20-64, the demographic groups most similar to Koreans are Immigrants from Israel (79.8%, a difference of 0.0%), Slovak (79.8%, a difference of 0.0%), Immigrants from Sweden (79.8%, a difference of 0.0%), Pakistani (79.8%, a difference of 0.0%), and Immigrants from South Eastern Asia (79.8%, a difference of 0.010%). Similarly, the demographic groups most similar to Immigrants from Nigeria are Immigrants from Ukraine (79.9%, a difference of 0.0%), Ukrainian (79.9%, a difference of 0.010%), Immigrants from Singapore (79.9%, a difference of 0.010%), Indian (Asian) (79.9%, a difference of 0.020%), and South American Indian (79.9%, a difference of 0.020%).
| Demographics | Rating | Rank | In Labor Force | Age 20-64 |
| Immigrants | Iran | 88.3 /100 | #131 | Excellent 79.9% |
| Indians (Asian) | 87.7 /100 | #132 | Excellent 79.9% |
| South American Indians | 87.6 /100 | #133 | Excellent 79.9% |
| Belgians | 87.4 /100 | #134 | Excellent 79.9% |
| Ukrainians | 86.8 /100 | #135 | Excellent 79.9% |
| Immigrants | Singapore | 86.7 /100 | #136 | Excellent 79.9% |
| Immigrants | Ukraine | 86.5 /100 | #137 | Excellent 79.9% |
| Immigrants | Nigeria | 86.4 /100 | #138 | Excellent 79.9% |
| Immigrants | Spain | 83.9 /100 | #139 | Excellent 79.8% |
| Immigrants | South Eastern Asia | 80.4 /100 | #140 | Excellent 79.8% |
| Immigrants | Israel | 80.0 /100 | #141 | Good 79.8% |
| Slovaks | 79.9 /100 | #142 | Good 79.8% |
| Immigrants | Sweden | 79.7 /100 | #143 | Good 79.8% |
| Koreans | 79.6 /100 | #144 | Good 79.8% |
| Pakistanis | 79.3 /100 | #145 | Good 79.8% |
| Immigrants | Southern Europe | 78.9 /100 | #146 | Good 79.8% |
| Immigrants | Philippines | 78.0 /100 | #147 | Good 79.8% |
| Romanians | 77.6 /100 | #148 | Good 79.8% |
| Icelanders | 75.1 /100 | #149 | Good 79.7% |
| Costa Ricans | 72.4 /100 | #150 | Good 79.7% |
| Scandinavians | 72.0 /100 | #151 | Good 79.7% |