Korean vs Immigrants from Somalia In Labor Force | Age 16-19
COMPARE
Korean
Immigrants from Somalia
In Labor Force | Age 16-19
In Labor Force | Age 16-19 Comparison
Koreans
Immigrants from Somalia
35.7%
IN LABOR FORCE | AGE 16-19
13.3/ 100
METRIC RATING
208th/ 347
METRIC RANK
45.6%
IN LABOR FORCE | AGE 16-19
100.0/ 100
METRIC RATING
3rd/ 347
METRIC RANK
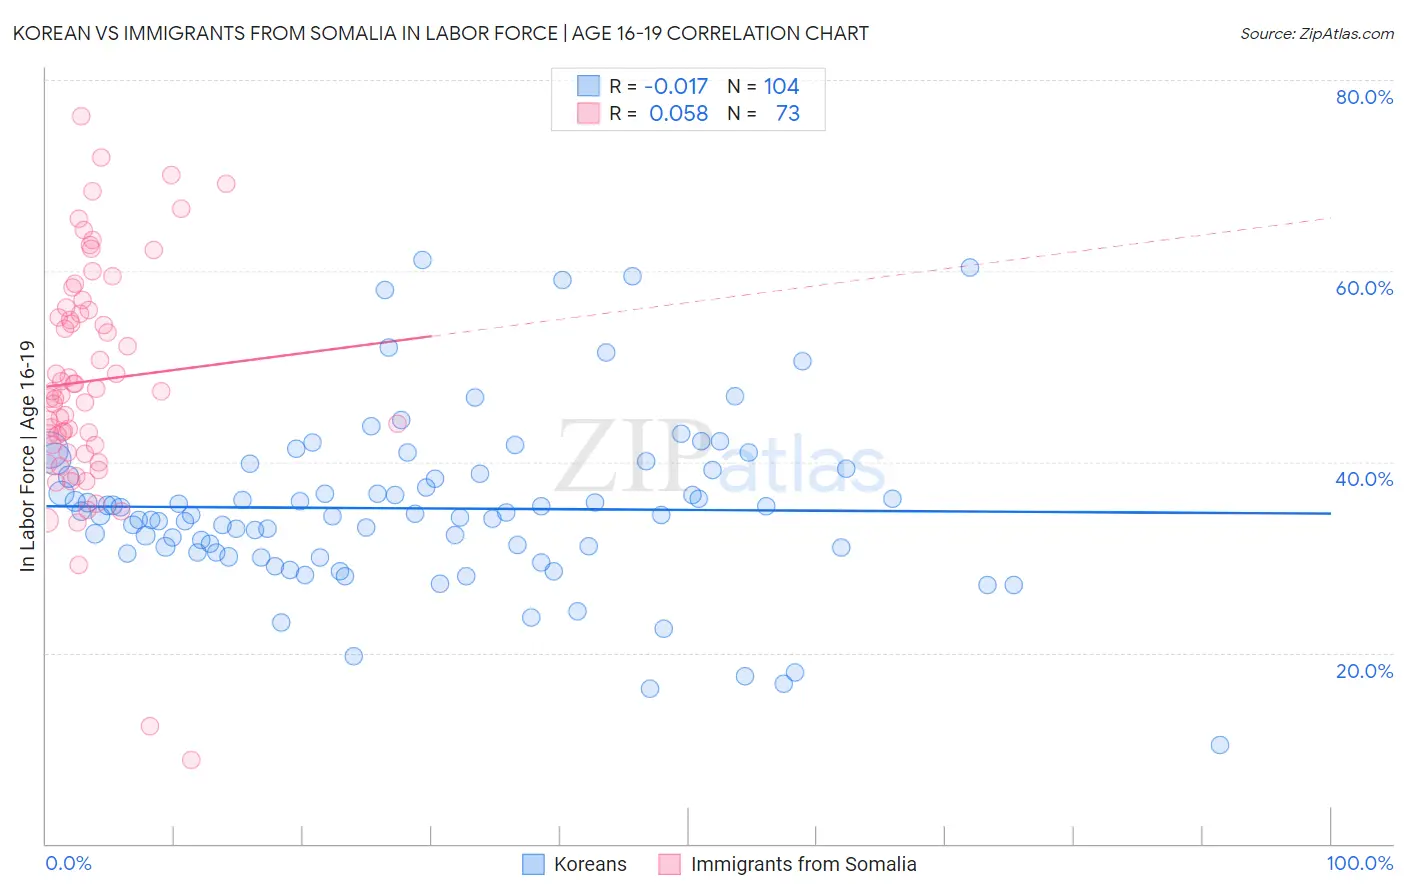
Korean vs Immigrants from Somalia In Labor Force | Age 16-19 Correlation Chart
The statistical analysis conducted on geographies consisting of 509,513,033 people shows no correlation between the proportion of Koreans and labor force participation rate among population between the ages 16 and 19 in the United States with a correlation coefficient (R) of -0.017 and weighted average of 35.7%. Similarly, the statistical analysis conducted on geographies consisting of 92,098,328 people shows a slight positive correlation between the proportion of Immigrants from Somalia and labor force participation rate among population between the ages 16 and 19 in the United States with a correlation coefficient (R) of 0.058 and weighted average of 45.6%, a difference of 27.6%.
In Labor Force | Age 16-19 Correlation Summary
| Measurement | Korean | Immigrants from Somalia |
| Minimum | 10.4% | 8.8% |
| Maximum | 61.1% | 76.2% |
| Range | 50.7% | 67.4% |
| Mean | 35.1% | 48.5% |
| Median | 34.4% | 47.4% |
| Interquartile 25% (IQ1) | 30.5% | 41.4% |
| Interquartile 75% (IQ3) | 39.0% | 56.1% |
| Interquartile Range (IQR) | 8.4% | 14.7% |
| Standard Deviation (Sample) | 9.0% | 12.2% |
| Standard Deviation (Population) | 8.9% | 12.1% |
Similar Demographics by In Labor Force | Age 16-19
Demographics Similar to Koreans by In Labor Force | Age 16-19
In terms of in labor force | age 16-19, the demographic groups most similar to Koreans are Moroccan (35.7%, a difference of 0.070%), Immigrants from Eastern Europe (35.8%, a difference of 0.12%), South American Indian (35.8%, a difference of 0.14%), Chilean (35.8%, a difference of 0.14%), and Immigrants from Albania (35.8%, a difference of 0.17%).
| Demographics | Rating | Rank | In Labor Force | Age 16-19 |
| Alsatians | 17.5 /100 | #201 | Poor 35.9% |
| Senegalese | 17.4 /100 | #202 | Poor 35.9% |
| Immigrants | Nigeria | 16.8 /100 | #203 | Poor 35.8% |
| Immigrants | Albania | 15.0 /100 | #204 | Poor 35.8% |
| South American Indians | 14.6 /100 | #205 | Poor 35.8% |
| Chileans | 14.6 /100 | #206 | Poor 35.8% |
| Immigrants | Eastern Europe | 14.5 /100 | #207 | Poor 35.8% |
| Koreans | 13.3 /100 | #208 | Poor 35.7% |
| Moroccans | 12.7 /100 | #209 | Poor 35.7% |
| Immigrants | Switzerland | 11.9 /100 | #210 | Poor 35.6% |
| Mexicans | 11.9 /100 | #211 | Poor 35.6% |
| Houma | 11.0 /100 | #212 | Poor 35.6% |
| Immigrants | Bolivia | 11.0 /100 | #213 | Poor 35.6% |
| Apache | 11.0 /100 | #214 | Poor 35.6% |
| Immigrants | South Eastern Asia | 10.8 /100 | #215 | Poor 35.6% |
Demographics Similar to Immigrants from Somalia by In Labor Force | Age 16-19
In terms of in labor force | age 16-19, the demographic groups most similar to Immigrants from Somalia are Luxembourger (45.3%, a difference of 0.65%), Alaskan Athabascan (45.2%, a difference of 0.83%), Somali (45.1%, a difference of 1.0%), Norwegian (46.2%, a difference of 1.3%), and Pennsylvania German (46.4%, a difference of 1.9%).
| Demographics | Rating | Rank | In Labor Force | Age 16-19 |
| Pennsylvania Germans | 100.0 /100 | #1 | Exceptional 46.4% |
| Norwegians | 100.0 /100 | #2 | Exceptional 46.2% |
| Immigrants | Somalia | 100.0 /100 | #3 | Exceptional 45.6% |
| Luxembourgers | 100.0 /100 | #4 | Exceptional 45.3% |
| Alaskan Athabascans | 100.0 /100 | #5 | Exceptional 45.2% |
| Somalis | 100.0 /100 | #6 | Exceptional 45.1% |
| Danes | 100.0 /100 | #7 | Exceptional 44.7% |
| Immigrants | Cabo Verde | 100.0 /100 | #8 | Exceptional 44.7% |
| Cape Verdeans | 100.0 /100 | #9 | Exceptional 44.5% |
| Germans | 100.0 /100 | #10 | Exceptional 44.2% |
| Swedes | 100.0 /100 | #11 | Exceptional 44.1% |
| Finns | 100.0 /100 | #12 | Exceptional 43.9% |
| Dutch | 100.0 /100 | #13 | Exceptional 43.8% |
| Chippewa | 100.0 /100 | #14 | Exceptional 43.8% |
| Slovenes | 100.0 /100 | #15 | Exceptional 43.7% |