Immigrants from Nicaragua vs Immigrants from Somalia In Labor Force | Age 16-19
COMPARE
Immigrants from Nicaragua
Immigrants from Somalia
In Labor Force | Age 16-19
In Labor Force | Age 16-19 Comparison
Immigrants from Nicaragua
Immigrants from Somalia
31.6%
IN LABOR FORCE | AGE 16-19
0.0/ 100
METRIC RATING
317th/ 347
METRIC RANK
45.6%
IN LABOR FORCE | AGE 16-19
100.0/ 100
METRIC RATING
3rd/ 347
METRIC RANK
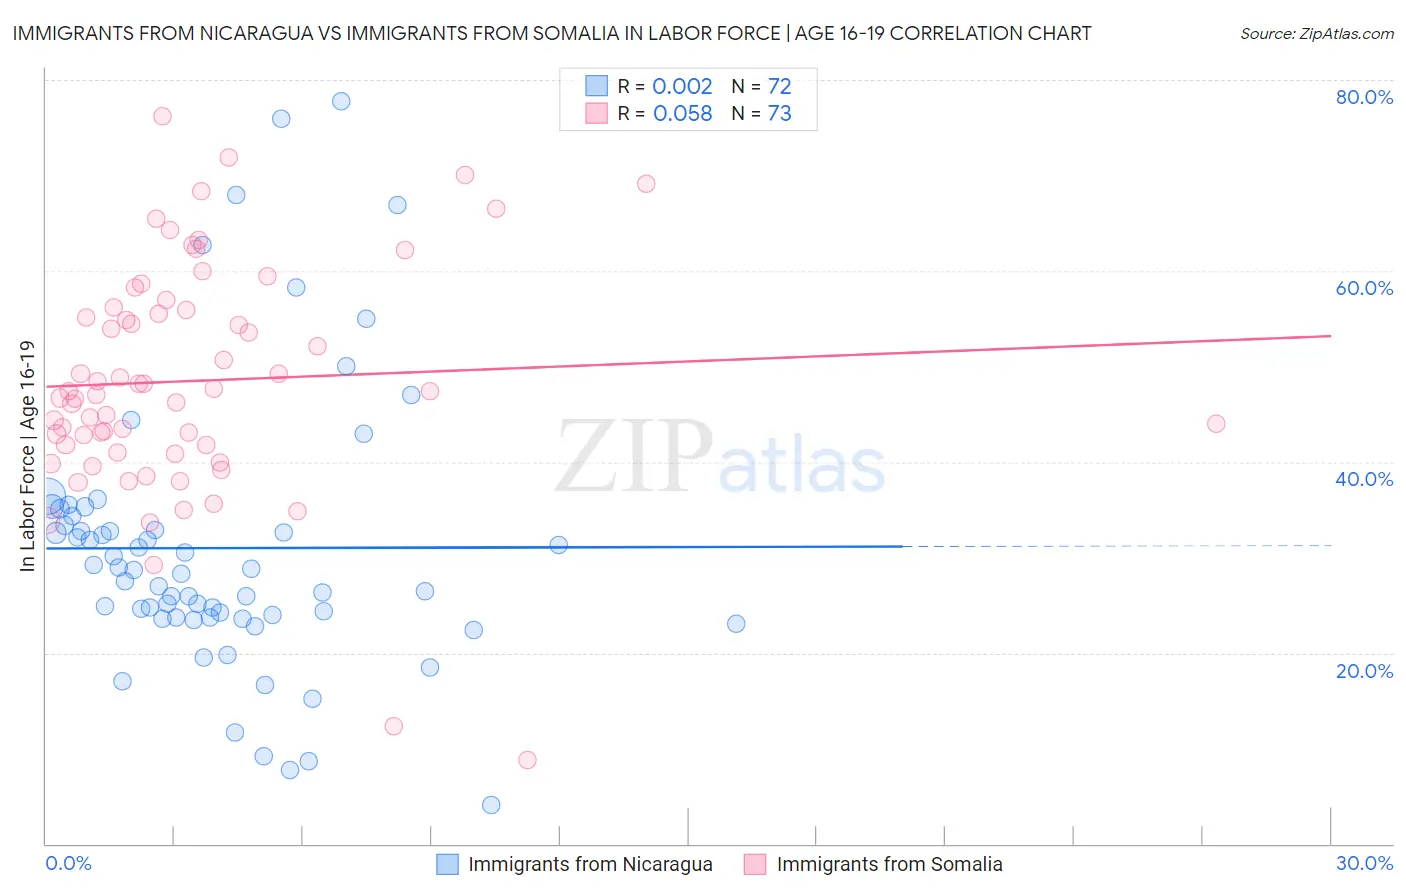
Immigrants from Nicaragua vs Immigrants from Somalia In Labor Force | Age 16-19 Correlation Chart
The statistical analysis conducted on geographies consisting of 236,189,359 people shows no correlation between the proportion of Immigrants from Nicaragua and labor force participation rate among population between the ages 16 and 19 in the United States with a correlation coefficient (R) of 0.002 and weighted average of 31.6%. Similarly, the statistical analysis conducted on geographies consisting of 92,098,328 people shows a slight positive correlation between the proportion of Immigrants from Somalia and labor force participation rate among population between the ages 16 and 19 in the United States with a correlation coefficient (R) of 0.058 and weighted average of 45.6%, a difference of 44.1%.
In Labor Force | Age 16-19 Correlation Summary
| Measurement | Immigrants from Nicaragua | Immigrants from Somalia |
| Minimum | 4.1% | 8.8% |
| Maximum | 77.8% | 76.2% |
| Range | 73.7% | 67.4% |
| Mean | 31.0% | 48.5% |
| Median | 28.5% | 47.4% |
| Interquartile 25% (IQ1) | 23.7% | 41.4% |
| Interquartile 75% (IQ3) | 33.8% | 56.1% |
| Interquartile Range (IQR) | 10.1% | 14.7% |
| Standard Deviation (Sample) | 14.5% | 12.2% |
| Standard Deviation (Population) | 14.4% | 12.1% |
Similar Demographics by In Labor Force | Age 16-19
Demographics Similar to Immigrants from Nicaragua by In Labor Force | Age 16-19
In terms of in labor force | age 16-19, the demographic groups most similar to Immigrants from Nicaragua are Filipino (31.7%, a difference of 0.19%), Immigrants from West Indies (31.7%, a difference of 0.28%), Immigrants from Yemen (31.5%, a difference of 0.34%), Cuban (31.8%, a difference of 0.46%), and Hopi (31.8%, a difference of 0.61%).
| Demographics | Rating | Rank | In Labor Force | Age 16-19 |
| Immigrants | Iran | 0.0 /100 | #310 | Tragic 32.0% |
| Indians (Asian) | 0.0 /100 | #311 | Tragic 31.9% |
| Immigrants | Belize | 0.0 /100 | #312 | Tragic 31.8% |
| Hopi | 0.0 /100 | #313 | Tragic 31.8% |
| Cubans | 0.0 /100 | #314 | Tragic 31.8% |
| Immigrants | West Indies | 0.0 /100 | #315 | Tragic 31.7% |
| Filipinos | 0.0 /100 | #316 | Tragic 31.7% |
| Immigrants | Nicaragua | 0.0 /100 | #317 | Tragic 31.6% |
| Immigrants | Yemen | 0.0 /100 | #318 | Tragic 31.5% |
| Soviet Union | 0.0 /100 | #319 | Tragic 31.4% |
| Ecuadorians | 0.0 /100 | #320 | Tragic 31.4% |
| West Indians | 0.0 /100 | #321 | Tragic 31.3% |
| Tohono O'odham | 0.0 /100 | #322 | Tragic 31.3% |
| Immigrants | Caribbean | 0.0 /100 | #323 | Tragic 31.2% |
| Dominicans | 0.0 /100 | #324 | Tragic 31.2% |
Demographics Similar to Immigrants from Somalia by In Labor Force | Age 16-19
In terms of in labor force | age 16-19, the demographic groups most similar to Immigrants from Somalia are Luxembourger (45.3%, a difference of 0.65%), Alaskan Athabascan (45.2%, a difference of 0.83%), Somali (45.1%, a difference of 1.0%), Norwegian (46.2%, a difference of 1.3%), and Pennsylvania German (46.4%, a difference of 1.9%).
| Demographics | Rating | Rank | In Labor Force | Age 16-19 |
| Pennsylvania Germans | 100.0 /100 | #1 | Exceptional 46.4% |
| Norwegians | 100.0 /100 | #2 | Exceptional 46.2% |
| Immigrants | Somalia | 100.0 /100 | #3 | Exceptional 45.6% |
| Luxembourgers | 100.0 /100 | #4 | Exceptional 45.3% |
| Alaskan Athabascans | 100.0 /100 | #5 | Exceptional 45.2% |
| Somalis | 100.0 /100 | #6 | Exceptional 45.1% |
| Danes | 100.0 /100 | #7 | Exceptional 44.7% |
| Immigrants | Cabo Verde | 100.0 /100 | #8 | Exceptional 44.7% |
| Cape Verdeans | 100.0 /100 | #9 | Exceptional 44.5% |
| Germans | 100.0 /100 | #10 | Exceptional 44.2% |
| Swedes | 100.0 /100 | #11 | Exceptional 44.1% |
| Finns | 100.0 /100 | #12 | Exceptional 43.9% |
| Dutch | 100.0 /100 | #13 | Exceptional 43.8% |
| Chippewa | 100.0 /100 | #14 | Exceptional 43.8% |
| Slovenes | 100.0 /100 | #15 | Exceptional 43.7% |