Korean vs Arapaho In Labor Force | Age 16-19
COMPARE
Korean
Arapaho
In Labor Force | Age 16-19
In Labor Force | Age 16-19 Comparison
Koreans
Arapaho
35.7%
IN LABOR FORCE | AGE 16-19
13.3/ 100
METRIC RATING
208th/ 347
METRIC RANK
37.3%
IN LABOR FORCE | AGE 16-19
81.8/ 100
METRIC RATING
153rd/ 347
METRIC RANK
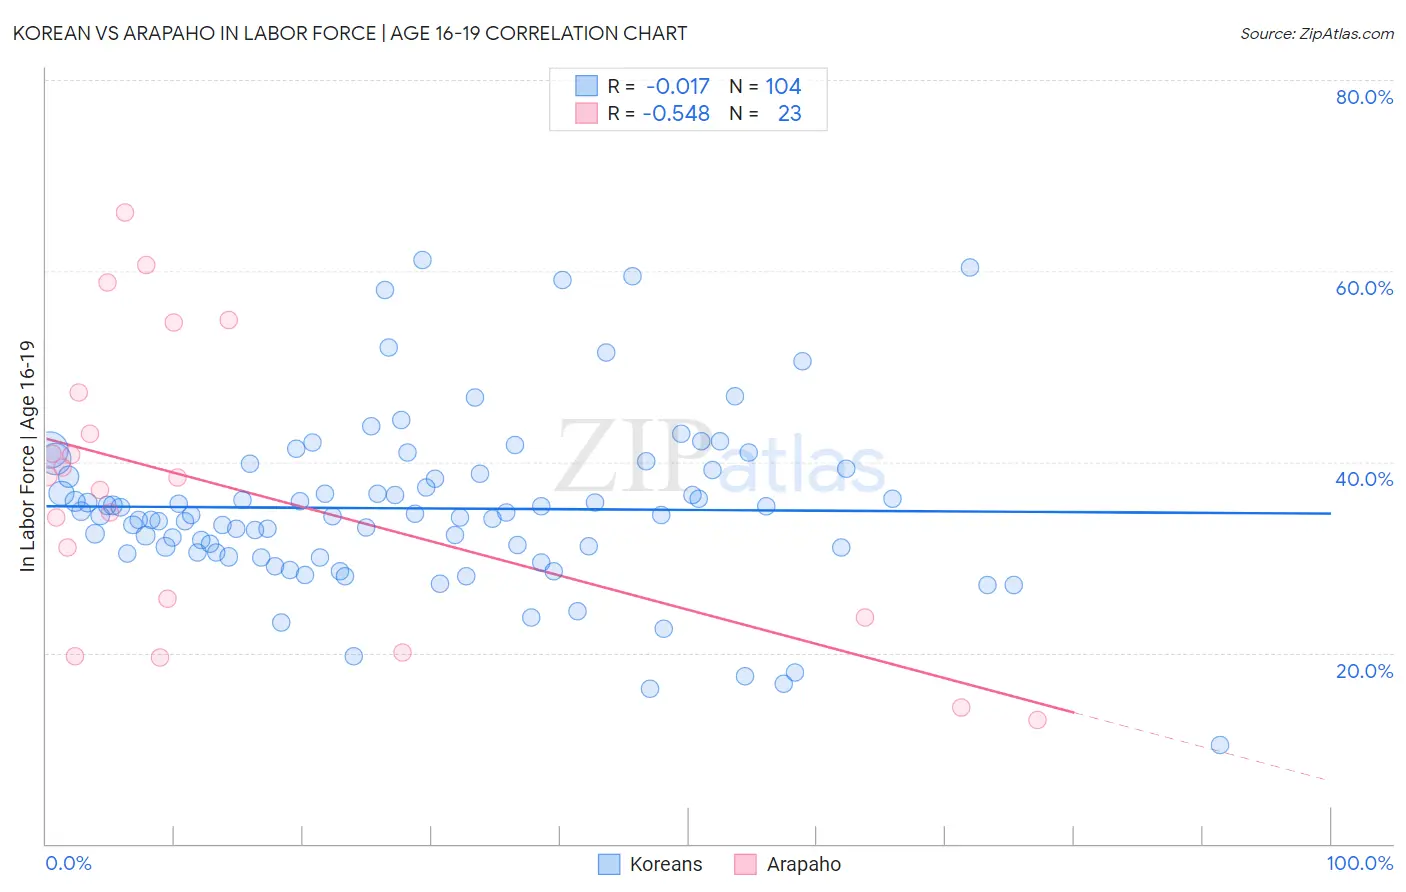
Korean vs Arapaho In Labor Force | Age 16-19 Correlation Chart
The statistical analysis conducted on geographies consisting of 509,513,033 people shows no correlation between the proportion of Koreans and labor force participation rate among population between the ages 16 and 19 in the United States with a correlation coefficient (R) of -0.017 and weighted average of 35.7%. Similarly, the statistical analysis conducted on geographies consisting of 29,768,466 people shows a substantial negative correlation between the proportion of Arapaho and labor force participation rate among population between the ages 16 and 19 in the United States with a correlation coefficient (R) of -0.548 and weighted average of 37.3%, a difference of 4.3%.
In Labor Force | Age 16-19 Correlation Summary
| Measurement | Korean | Arapaho |
| Minimum | 10.4% | 13.0% |
| Maximum | 61.1% | 66.1% |
| Range | 50.7% | 53.1% |
| Mean | 35.1% | 37.2% |
| Median | 34.4% | 38.3% |
| Interquartile 25% (IQ1) | 30.5% | 23.7% |
| Interquartile 75% (IQ3) | 39.0% | 47.3% |
| Interquartile Range (IQR) | 8.4% | 23.6% |
| Standard Deviation (Sample) | 9.0% | 15.1% |
| Standard Deviation (Population) | 8.9% | 14.8% |
Similar Demographics by In Labor Force | Age 16-19
Demographics Similar to Koreans by In Labor Force | Age 16-19
In terms of in labor force | age 16-19, the demographic groups most similar to Koreans are Moroccan (35.7%, a difference of 0.070%), Immigrants from Eastern Europe (35.8%, a difference of 0.12%), South American Indian (35.8%, a difference of 0.14%), Chilean (35.8%, a difference of 0.14%), and Immigrants from Albania (35.8%, a difference of 0.17%).
| Demographics | Rating | Rank | In Labor Force | Age 16-19 |
| Alsatians | 17.5 /100 | #201 | Poor 35.9% |
| Senegalese | 17.4 /100 | #202 | Poor 35.9% |
| Immigrants | Nigeria | 16.8 /100 | #203 | Poor 35.8% |
| Immigrants | Albania | 15.0 /100 | #204 | Poor 35.8% |
| South American Indians | 14.6 /100 | #205 | Poor 35.8% |
| Chileans | 14.6 /100 | #206 | Poor 35.8% |
| Immigrants | Eastern Europe | 14.5 /100 | #207 | Poor 35.8% |
| Koreans | 13.3 /100 | #208 | Poor 35.7% |
| Moroccans | 12.7 /100 | #209 | Poor 35.7% |
| Immigrants | Switzerland | 11.9 /100 | #210 | Poor 35.6% |
| Mexicans | 11.9 /100 | #211 | Poor 35.6% |
| Houma | 11.0 /100 | #212 | Poor 35.6% |
| Immigrants | Bolivia | 11.0 /100 | #213 | Poor 35.6% |
| Apache | 11.0 /100 | #214 | Poor 35.6% |
| Immigrants | South Eastern Asia | 10.8 /100 | #215 | Poor 35.6% |
Demographics Similar to Arapaho by In Labor Force | Age 16-19
In terms of in labor force | age 16-19, the demographic groups most similar to Arapaho are Immigrants from Bulgaria (37.3%, a difference of 0.020%), Immigrants from Lithuania (37.2%, a difference of 0.090%), Kiowa (37.2%, a difference of 0.12%), Immigrants from Sierra Leone (37.3%, a difference of 0.15%), and Immigrants from Poland (37.3%, a difference of 0.23%).
| Demographics | Rating | Rank | In Labor Force | Age 16-19 |
| Immigrants | Western Europe | 88.9 /100 | #146 | Excellent 37.5% |
| Brazilians | 88.7 /100 | #147 | Excellent 37.5% |
| Romanians | 87.3 /100 | #148 | Excellent 37.5% |
| Native Hawaiians | 85.0 /100 | #149 | Excellent 37.4% |
| Tsimshian | 84.7 /100 | #150 | Excellent 37.4% |
| Immigrants | Poland | 84.4 /100 | #151 | Excellent 37.3% |
| Immigrants | Sierra Leone | 83.6 /100 | #152 | Excellent 37.3% |
| Arapaho | 81.8 /100 | #153 | Excellent 37.3% |
| Immigrants | Bulgaria | 81.6 /100 | #154 | Excellent 37.3% |
| Immigrants | Lithuania | 80.7 /100 | #155 | Excellent 37.2% |
| Kiowa | 80.4 /100 | #156 | Excellent 37.2% |
| Immigrants | Brazil | 76.5 /100 | #157 | Good 37.1% |
| Ute | 75.7 /100 | #158 | Good 37.1% |
| Yaqui | 74.4 /100 | #159 | Good 37.1% |
| Immigrants | Saudi Arabia | 73.9 /100 | #160 | Good 37.0% |