Chilean vs Immigrants from Egypt In Labor Force | Age 30-34
COMPARE
Chilean
Immigrants from Egypt
In Labor Force | Age 30-34
In Labor Force | Age 30-34 Comparison
Chileans
Immigrants from Egypt
84.9%
IN LABOR FORCE | AGE 30-34
85.3/ 100
METRIC RATING
141st/ 347
METRIC RANK
85.1%
IN LABOR FORCE | AGE 30-34
93.2/ 100
METRIC RATING
121st/ 347
METRIC RANK
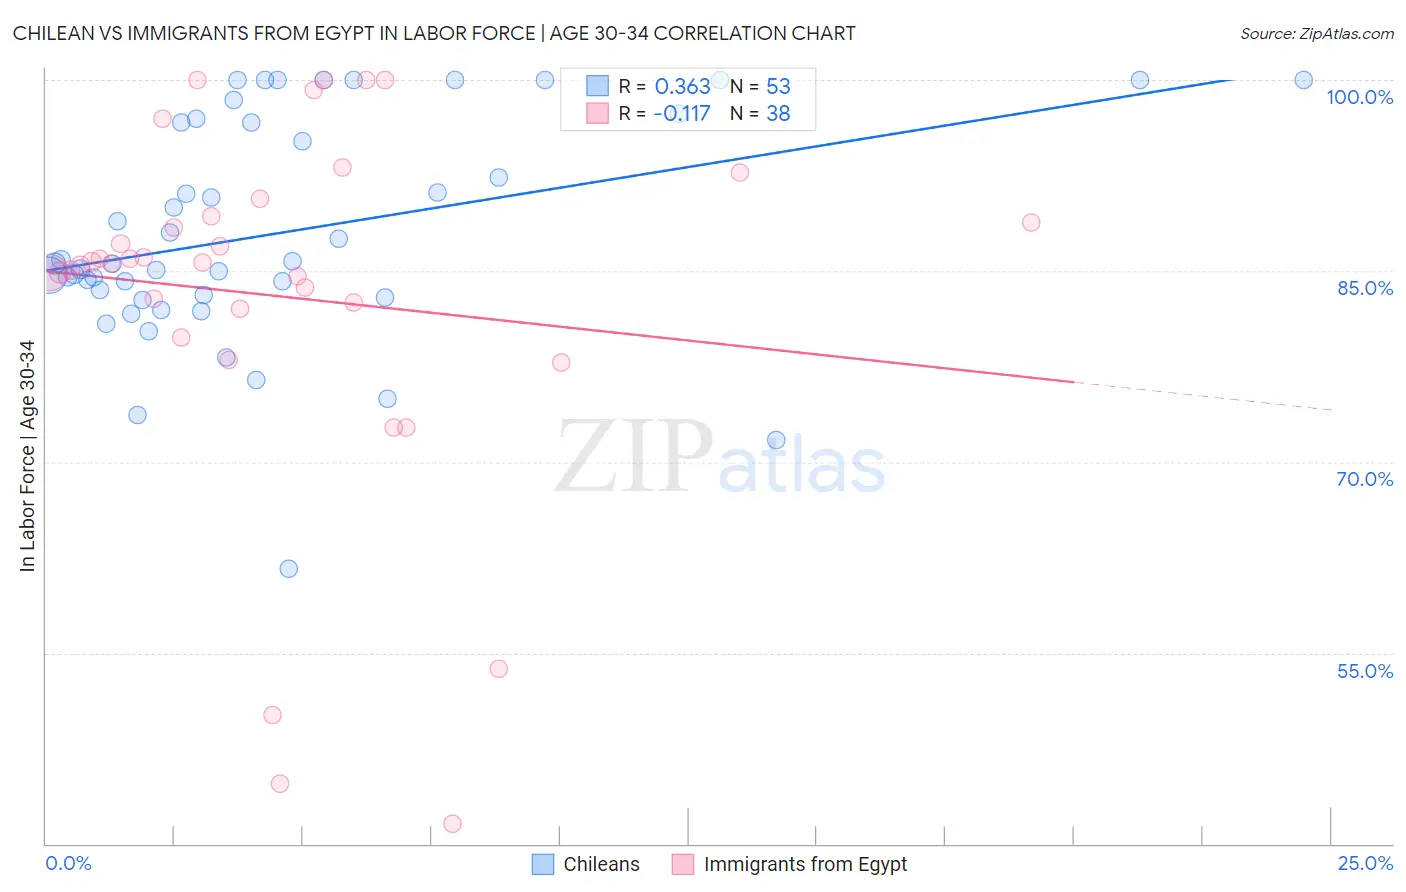
Chilean vs Immigrants from Egypt In Labor Force | Age 30-34 Correlation Chart
The statistical analysis conducted on geographies consisting of 256,589,082 people shows a mild positive correlation between the proportion of Chileans and labor force participation rate among population between the ages 30 and 34 in the United States with a correlation coefficient (R) of 0.363 and weighted average of 84.9%. Similarly, the statistical analysis conducted on geographies consisting of 245,430,177 people shows a poor negative correlation between the proportion of Immigrants from Egypt and labor force participation rate among population between the ages 30 and 34 in the United States with a correlation coefficient (R) of -0.117 and weighted average of 85.1%, a difference of 0.15%.
In Labor Force | Age 30-34 Correlation Summary
| Measurement | Chilean | Immigrants from Egypt |
| Minimum | 61.6% | 41.6% |
| Maximum | 100.0% | 100.0% |
| Range | 38.4% | 58.4% |
| Mean | 88.0% | 83.0% |
| Median | 85.6% | 85.6% |
| Interquartile 25% (IQ1) | 83.0% | 82.0% |
| Interquartile 75% (IQ3) | 96.8% | 89.3% |
| Interquartile Range (IQR) | 13.8% | 7.3% |
| Standard Deviation (Sample) | 8.8% | 14.2% |
| Standard Deviation (Population) | 8.7% | 14.0% |
Demographics Similar to Chileans and Immigrants from Egypt by In Labor Force | Age 30-34
In terms of in labor force | age 30-34, the demographic groups most similar to Chileans are Immigrants from Vietnam (85.0%, a difference of 0.020%), Bhutanese (85.0%, a difference of 0.030%), South African (85.0%, a difference of 0.040%), Sri Lankan (85.0%, a difference of 0.040%), and Jordanian (85.0%, a difference of 0.050%). Similarly, the demographic groups most similar to Immigrants from Egypt are Immigrants from Kuwait (85.1%, a difference of 0.020%), Armenian (85.0%, a difference of 0.030%), Australian (85.0%, a difference of 0.030%), Immigrants from Jordan (85.0%, a difference of 0.040%), and Austrian (85.0%, a difference of 0.050%).
| Demographics | Rating | Rank | In Labor Force | Age 30-34 |
| Immigrants | Egypt | 93.2 /100 | #121 | Exceptional 85.1% |
| Immigrants | Kuwait | 92.6 /100 | #122 | Exceptional 85.1% |
| Armenians | 92.2 /100 | #123 | Exceptional 85.0% |
| Australians | 92.0 /100 | #124 | Exceptional 85.0% |
| Immigrants | Jordan | 91.5 /100 | #125 | Exceptional 85.0% |
| Austrians | 90.9 /100 | #126 | Exceptional 85.0% |
| Slavs | 90.7 /100 | #127 | Exceptional 85.0% |
| Immigrants | Argentina | 90.6 /100 | #128 | Exceptional 85.0% |
| Immigrants | Western Africa | 90.2 /100 | #129 | Exceptional 85.0% |
| Immigrants | Spain | 90.0 /100 | #130 | Exceptional 85.0% |
| Chinese | 89.6 /100 | #131 | Excellent 85.0% |
| Immigrants | Israel | 89.5 /100 | #132 | Excellent 85.0% |
| New Zealanders | 89.5 /100 | #133 | Excellent 85.0% |
| Immigrants | Chile | 89.2 /100 | #134 | Excellent 85.0% |
| Immigrants | Asia | 88.9 /100 | #135 | Excellent 85.0% |
| Jordanians | 88.6 /100 | #136 | Excellent 85.0% |
| South Africans | 88.0 /100 | #137 | Excellent 85.0% |
| Sri Lankans | 87.8 /100 | #138 | Excellent 85.0% |
| Bhutanese | 87.5 /100 | #139 | Excellent 85.0% |
| Immigrants | Vietnam | 86.5 /100 | #140 | Excellent 85.0% |
| Chileans | 85.3 /100 | #141 | Excellent 84.9% |