Jamaican vs Palestinian In Labor Force | Age 16-19
COMPARE
Jamaican
Palestinian
In Labor Force | Age 16-19
In Labor Force | Age 16-19 Comparison
Jamaicans
Palestinians
33.2%
IN LABOR FORCE | AGE 16-19
0.1/ 100
METRIC RATING
296th/ 347
METRIC RANK
36.8%
IN LABOR FORCE | AGE 16-19
63.1/ 100
METRIC RATING
168th/ 347
METRIC RANK
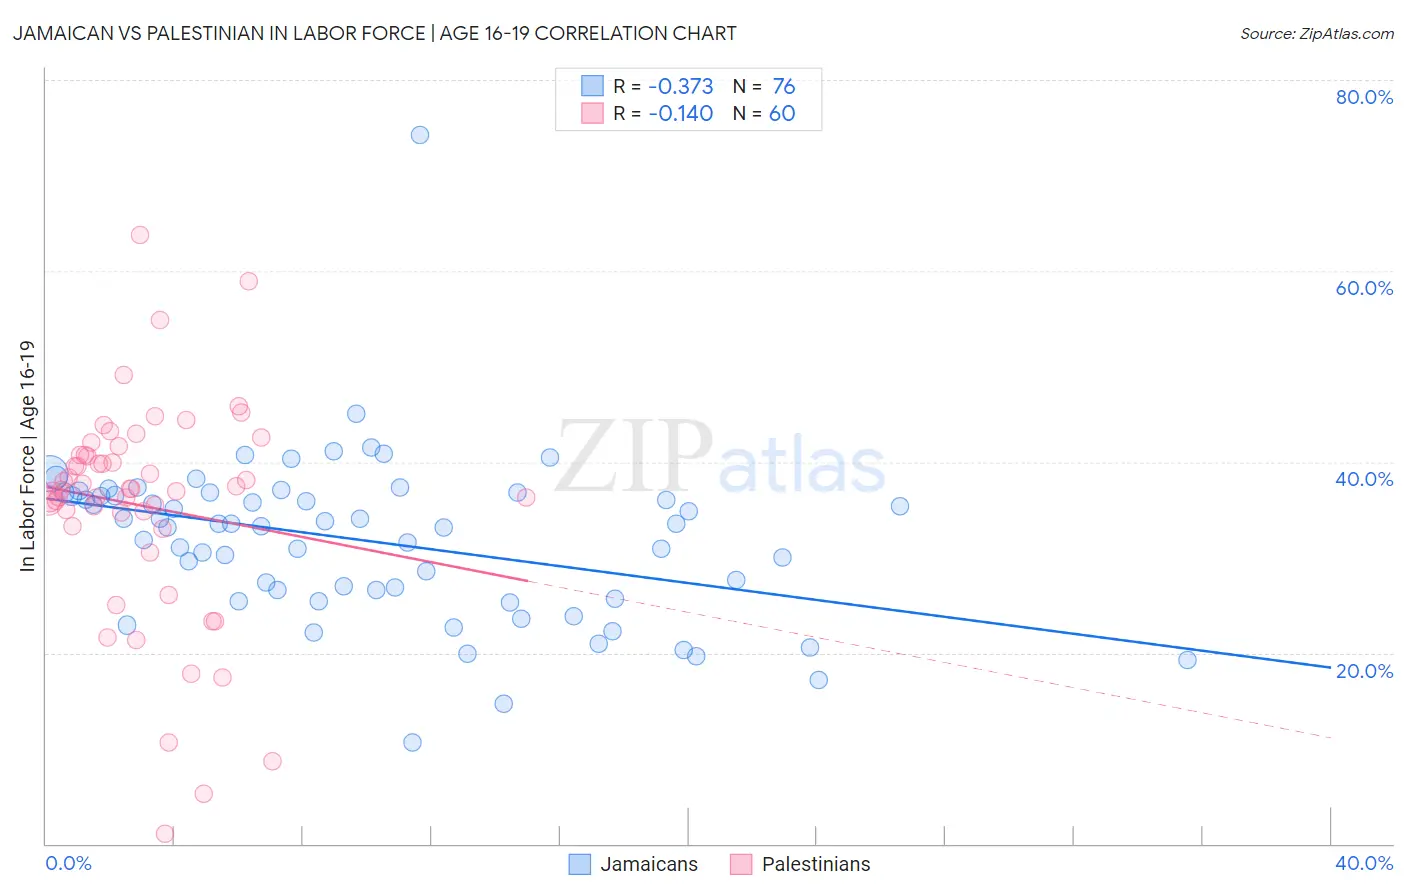
Jamaican vs Palestinian In Labor Force | Age 16-19 Correlation Chart
The statistical analysis conducted on geographies consisting of 367,624,466 people shows a mild negative correlation between the proportion of Jamaicans and labor force participation rate among population between the ages 16 and 19 in the United States with a correlation coefficient (R) of -0.373 and weighted average of 33.2%. Similarly, the statistical analysis conducted on geographies consisting of 216,397,857 people shows a poor negative correlation between the proportion of Palestinians and labor force participation rate among population between the ages 16 and 19 in the United States with a correlation coefficient (R) of -0.140 and weighted average of 36.8%, a difference of 10.8%.
In Labor Force | Age 16-19 Correlation Summary
| Measurement | Jamaican | Palestinian |
| Minimum | 10.6% | 1.1% |
| Maximum | 74.2% | 63.8% |
| Range | 63.6% | 62.7% |
| Mean | 31.7% | 35.4% |
| Median | 33.4% | 37.1% |
| Interquartile 25% (IQ1) | 26.1% | 34.0% |
| Interquartile 75% (IQ3) | 36.6% | 40.7% |
| Interquartile Range (IQR) | 10.5% | 6.8% |
| Standard Deviation (Sample) | 8.7% | 11.5% |
| Standard Deviation (Population) | 8.6% | 11.4% |
Similar Demographics by In Labor Force | Age 16-19
Demographics Similar to Jamaicans by In Labor Force | Age 16-19
In terms of in labor force | age 16-19, the demographic groups most similar to Jamaicans are Immigrants from Haiti (33.2%, a difference of 0.090%), Yup'ik (33.3%, a difference of 0.13%), Argentinean (33.3%, a difference of 0.23%), Immigrants from South America (33.3%, a difference of 0.25%), and Haitian (33.4%, a difference of 0.57%).
| Demographics | Rating | Rank | In Labor Force | Age 16-19 |
| Immigrants | Singapore | 0.1 /100 | #289 | Tragic 33.5% |
| Immigrants | Colombia | 0.1 /100 | #290 | Tragic 33.5% |
| Immigrants | Belarus | 0.1 /100 | #291 | Tragic 33.4% |
| Haitians | 0.1 /100 | #292 | Tragic 33.4% |
| Immigrants | South America | 0.1 /100 | #293 | Tragic 33.3% |
| Argentineans | 0.1 /100 | #294 | Tragic 33.3% |
| Yup'ik | 0.1 /100 | #295 | Tragic 33.3% |
| Jamaicans | 0.1 /100 | #296 | Tragic 33.2% |
| Immigrants | Haiti | 0.1 /100 | #297 | Tragic 33.2% |
| Iranians | 0.0 /100 | #298 | Tragic 33.0% |
| Armenians | 0.0 /100 | #299 | Tragic 32.9% |
| Immigrants | Argentina | 0.0 /100 | #300 | Tragic 32.9% |
| Okinawans | 0.0 /100 | #301 | Tragic 32.8% |
| Belizeans | 0.0 /100 | #302 | Tragic 32.8% |
| Immigrants | Dominica | 0.0 /100 | #303 | Tragic 32.5% |
Demographics Similar to Palestinians by In Labor Force | Age 16-19
In terms of in labor force | age 16-19, the demographic groups most similar to Palestinians are Arab (36.8%, a difference of 0.030%), Immigrants from Latvia (36.8%, a difference of 0.080%), Immigrants from South Africa (36.8%, a difference of 0.14%), Immigrants from Western Africa (36.9%, a difference of 0.20%), and Yakama (36.9%, a difference of 0.21%).
| Demographics | Rating | Rank | In Labor Force | Age 16-19 |
| Cambodians | 71.5 /100 | #161 | Good 37.0% |
| Immigrants | Jordan | 69.5 /100 | #162 | Good 36.9% |
| Bermudans | 69.3 /100 | #163 | Good 36.9% |
| Immigrants | Kuwait | 68.9 /100 | #164 | Good 36.9% |
| Yakama | 66.9 /100 | #165 | Good 36.9% |
| Immigrants | Western Africa | 66.7 /100 | #166 | Good 36.9% |
| Arabs | 63.6 /100 | #167 | Good 36.8% |
| Palestinians | 63.1 /100 | #168 | Good 36.8% |
| Immigrants | Latvia | 61.6 /100 | #169 | Good 36.8% |
| Immigrants | South Africa | 60.5 /100 | #170 | Good 36.8% |
| Immigrants | Cambodia | 58.4 /100 | #171 | Average 36.7% |
| South Africans | 58.3 /100 | #172 | Average 36.7% |
| Russians | 57.5 /100 | #173 | Average 36.7% |
| Immigrants | Czechoslovakia | 50.0 /100 | #174 | Average 36.6% |
| Natives/Alaskans | 49.0 /100 | #175 | Average 36.6% |