Jamaican vs Crow Unemployment Among Women with Children Under 18 years
COMPARE
Jamaican
Crow
Unemployment Among Women with Children Under 18 years
Unemployment Among Women with Children Under 18 years Comparison
Jamaicans
Crow
6.4%
UNEMPLOYMENT AMONG WOMEN WITH CHILDREN UNDER 18 YEARS
0.0/ 100
METRIC RATING
299th/ 347
METRIC RANK
8.2%
UNEMPLOYMENT AMONG WOMEN WITH CHILDREN UNDER 18 YEARS
0.0/ 100
METRIC RATING
340th/ 347
METRIC RANK
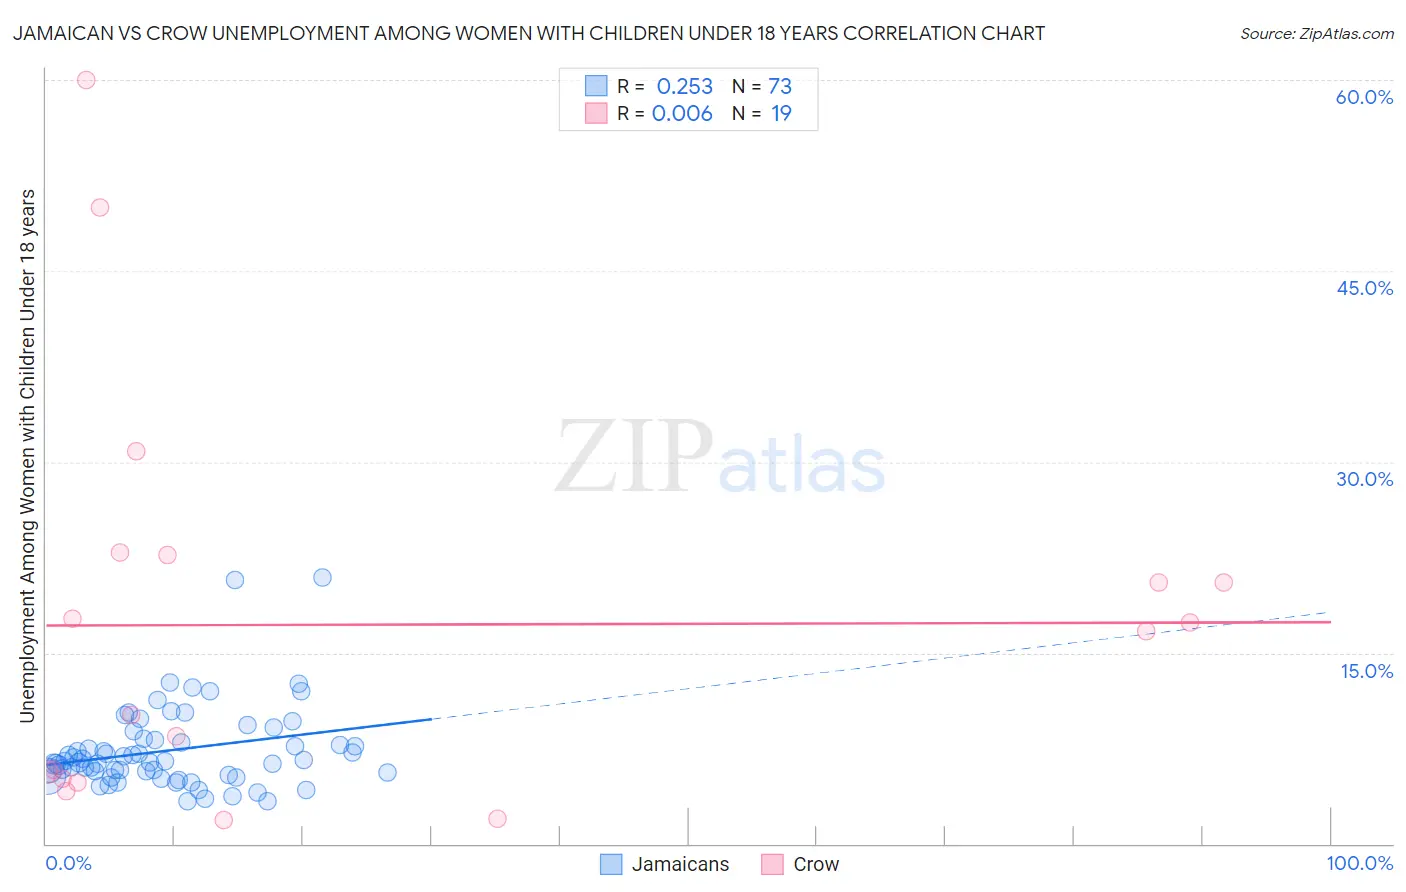
Jamaican vs Crow Unemployment Among Women with Children Under 18 years Correlation Chart
The statistical analysis conducted on geographies consisting of 356,105,986 people shows a weak positive correlation between the proportion of Jamaicans and unemployment rate among women with children under the age of 18 in the United States with a correlation coefficient (R) of 0.253 and weighted average of 6.4%. Similarly, the statistical analysis conducted on geographies consisting of 58,293,052 people shows no correlation between the proportion of Crow and unemployment rate among women with children under the age of 18 in the United States with a correlation coefficient (R) of 0.006 and weighted average of 8.2%, a difference of 28.3%.
Unemployment Among Women with Children Under 18 years Correlation Summary
| Measurement | Jamaican | Crow |
| Minimum | 3.3% | 1.9% |
| Maximum | 20.9% | 60.0% |
| Range | 17.6% | 58.1% |
| Mean | 7.3% | 17.2% |
| Median | 6.5% | 16.7% |
| Interquartile 25% (IQ1) | 5.5% | 5.1% |
| Interquartile 75% (IQ3) | 8.2% | 22.7% |
| Interquartile Range (IQR) | 2.7% | 17.6% |
| Standard Deviation (Sample) | 3.2% | 15.8% |
| Standard Deviation (Population) | 3.2% | 15.4% |
Similar Demographics by Unemployment Among Women with Children Under 18 years
Demographics Similar to Jamaicans by Unemployment Among Women with Children Under 18 years
In terms of unemployment among women with children under 18 years, the demographic groups most similar to Jamaicans are Immigrants from Jamaica (6.4%, a difference of 0.14%), Immigrants from Haiti (6.4%, a difference of 0.19%), Immigrants from Latin America (6.4%, a difference of 0.30%), Immigrants from Armenia (6.5%, a difference of 0.44%), and Immigrants from Senegal (6.4%, a difference of 0.55%).
| Demographics | Rating | Rank | Unemployment Among Women with Children Under 18 years |
| Mexicans | 0.0 /100 | #292 | Tragic 6.4% |
| Immigrants | Bangladesh | 0.0 /100 | #293 | Tragic 6.4% |
| Hondurans | 0.0 /100 | #294 | Tragic 6.4% |
| Barbadians | 0.0 /100 | #295 | Tragic 6.4% |
| Haitians | 0.0 /100 | #296 | Tragic 6.4% |
| Immigrants | Senegal | 0.0 /100 | #297 | Tragic 6.4% |
| Immigrants | Latin America | 0.0 /100 | #298 | Tragic 6.4% |
| Jamaicans | 0.0 /100 | #299 | Tragic 6.4% |
| Immigrants | Jamaica | 0.0 /100 | #300 | Tragic 6.4% |
| Immigrants | Haiti | 0.0 /100 | #301 | Tragic 6.4% |
| Immigrants | Armenia | 0.0 /100 | #302 | Tragic 6.5% |
| Immigrants | Honduras | 0.0 /100 | #303 | Tragic 6.5% |
| Vietnamese | 0.0 /100 | #304 | Tragic 6.5% |
| Immigrants | Central America | 0.0 /100 | #305 | Tragic 6.5% |
| Immigrants | Guyana | 0.0 /100 | #306 | Tragic 6.5% |
Demographics Similar to Crow by Unemployment Among Women with Children Under 18 years
In terms of unemployment among women with children under 18 years, the demographic groups most similar to Crow are Navajo (8.2%, a difference of 0.20%), Immigrants from Yemen (8.2%, a difference of 0.72%), Yakama (8.1%, a difference of 2.3%), Sioux (7.9%, a difference of 3.8%), and Apache (7.9%, a difference of 4.1%).
| Demographics | Rating | Rank | Unemployment Among Women with Children Under 18 years |
| Immigrants | Dominican Republic | 0.0 /100 | #333 | Tragic 7.5% |
| Cheyenne | 0.0 /100 | #334 | Tragic 7.8% |
| Apache | 0.0 /100 | #335 | Tragic 7.9% |
| Sioux | 0.0 /100 | #336 | Tragic 7.9% |
| Yakama | 0.0 /100 | #337 | Tragic 8.1% |
| Immigrants | Yemen | 0.0 /100 | #338 | Tragic 8.2% |
| Navajo | 0.0 /100 | #339 | Tragic 8.2% |
| Crow | 0.0 /100 | #340 | Tragic 8.2% |
| Tohono O'odham | 0.0 /100 | #341 | Tragic 8.9% |
| Puerto Ricans | 0.0 /100 | #342 | Tragic 9.0% |
| Arapaho | 0.0 /100 | #343 | Tragic 9.2% |
| Inupiat | 0.0 /100 | #344 | Tragic 9.6% |
| Yuman | 0.0 /100 | #345 | Tragic 9.8% |
| Yup'ik | 0.0 /100 | #346 | Tragic 11.0% |
| Pima | 0.0 /100 | #347 | Tragic 11.7% |