Italian vs Immigrants from Singapore In Labor Force | Age 45-54
COMPARE
Italian
Immigrants from Singapore
In Labor Force | Age 45-54
In Labor Force | Age 45-54 Comparison
Italians
Immigrants from Singapore
83.3%
IN LABOR FORCE | AGE 45-54
95.1/ 100
METRIC RATING
93rd/ 347
METRIC RANK
83.3%
IN LABOR FORCE | AGE 45-54
93.9/ 100
METRIC RATING
102nd/ 347
METRIC RANK
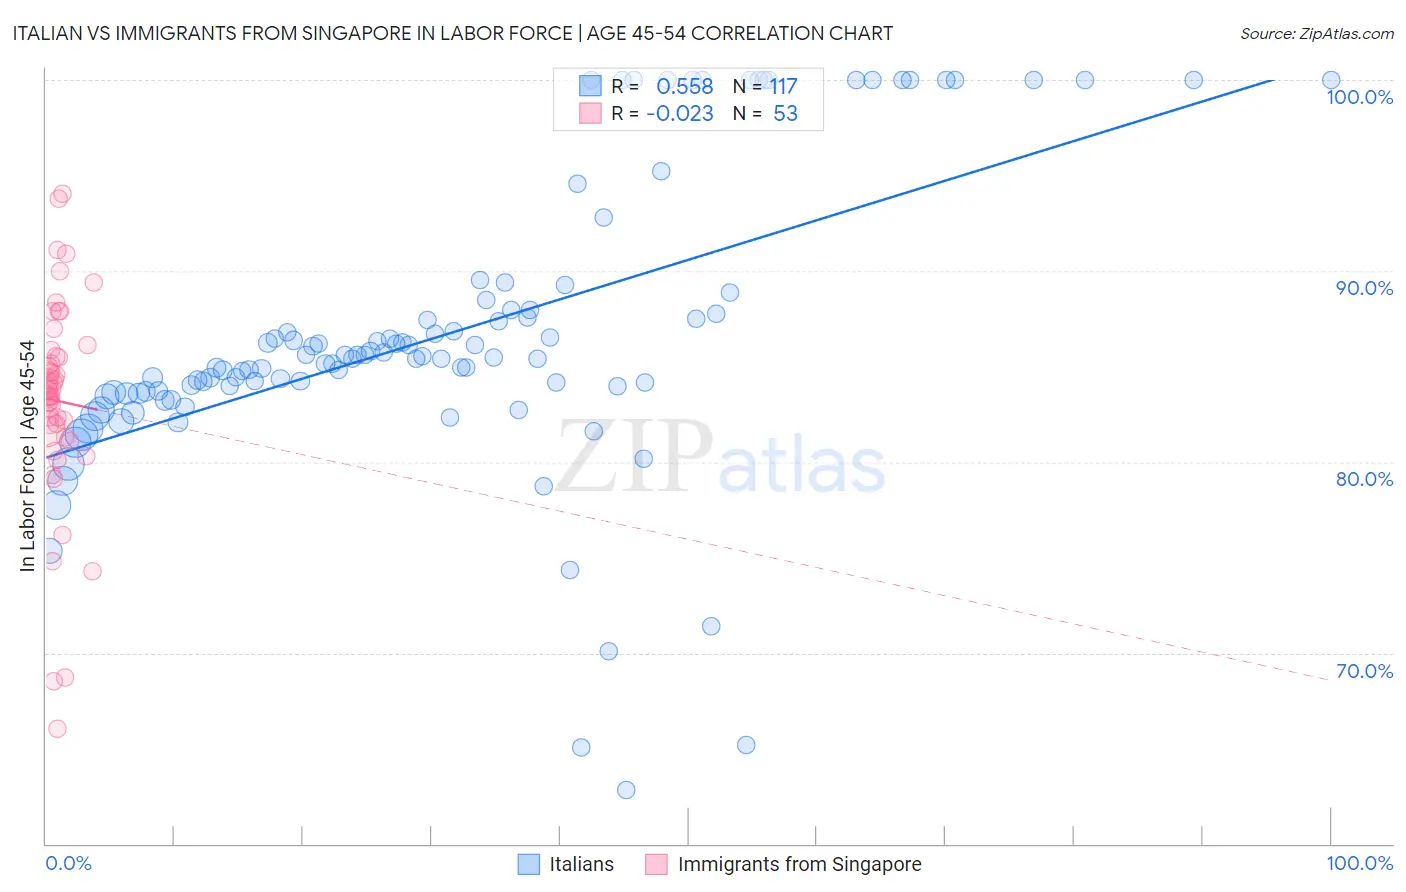
Italian vs Immigrants from Singapore In Labor Force | Age 45-54 Correlation Chart
The statistical analysis conducted on geographies consisting of 574,249,528 people shows a substantial positive correlation between the proportion of Italians and labor force participation rate among population between the ages 45 and 54 in the United States with a correlation coefficient (R) of 0.558 and weighted average of 83.3%. Similarly, the statistical analysis conducted on geographies consisting of 137,447,922 people shows no correlation between the proportion of Immigrants from Singapore and labor force participation rate among population between the ages 45 and 54 in the United States with a correlation coefficient (R) of -0.023 and weighted average of 83.3%, a difference of 0.050%.
In Labor Force | Age 45-54 Correlation Summary
| Measurement | Italian | Immigrants from Singapore |
| Minimum | 62.8% | 66.0% |
| Maximum | 100.0% | 94.0% |
| Range | 37.2% | 28.0% |
| Mean | 86.7% | 83.2% |
| Median | 85.4% | 83.7% |
| Interquartile 25% (IQ1) | 83.6% | 81.5% |
| Interquartile 75% (IQ3) | 87.9% | 85.7% |
| Interquartile Range (IQR) | 4.3% | 4.2% |
| Standard Deviation (Sample) | 7.7% | 5.5% |
| Standard Deviation (Population) | 7.6% | 5.5% |
Demographics Similar to Italians and Immigrants from Singapore by In Labor Force | Age 45-54
In terms of in labor force | age 45-54, the demographic groups most similar to Italians are Danish (83.3%, a difference of 0.010%), Argentinean (83.3%, a difference of 0.010%), Immigrants from Argentina (83.3%, a difference of 0.010%), Immigrants from Eastern Europe (83.3%, a difference of 0.020%), and Immigrants from Asia (83.3%, a difference of 0.020%). Similarly, the demographic groups most similar to Immigrants from Singapore are Albanian (83.3%, a difference of 0.0%), Immigrants from Romania (83.3%, a difference of 0.0%), Immigrants from Middle Africa (83.3%, a difference of 0.010%), Mongolian (83.3%, a difference of 0.010%), and Immigrants from Belarus (83.3%, a difference of 0.010%).
| Demographics | Rating | Rank | In Labor Force | Age 45-54 |
| Immigrants | Eastern Europe | 95.6 /100 | #87 | Exceptional 83.3% |
| Immigrants | Asia | 95.6 /100 | #88 | Exceptional 83.3% |
| Indians (Asian) | 95.5 /100 | #89 | Exceptional 83.3% |
| Immigrants | Japan | 95.5 /100 | #90 | Exceptional 83.3% |
| South Americans | 95.5 /100 | #91 | Exceptional 83.3% |
| Danes | 95.3 /100 | #92 | Exceptional 83.3% |
| Italians | 95.1 /100 | #93 | Exceptional 83.3% |
| Argentineans | 94.9 /100 | #94 | Exceptional 83.3% |
| Immigrants | Argentina | 94.9 /100 | #95 | Exceptional 83.3% |
| Immigrants | Kuwait | 94.8 /100 | #96 | Exceptional 83.3% |
| Palestinians | 94.8 /100 | #97 | Exceptional 83.3% |
| Maltese | 94.4 /100 | #98 | Exceptional 83.3% |
| Immigrants | Middle Africa | 94.3 /100 | #99 | Exceptional 83.3% |
| Mongolians | 94.2 /100 | #100 | Exceptional 83.3% |
| Immigrants | Belarus | 94.1 /100 | #101 | Exceptional 83.3% |
| Immigrants | Singapore | 93.9 /100 | #102 | Exceptional 83.3% |
| Albanians | 93.9 /100 | #103 | Exceptional 83.3% |
| Immigrants | Romania | 93.8 /100 | #104 | Exceptional 83.3% |
| Immigrants | South America | 93.5 /100 | #105 | Exceptional 83.2% |
| Sri Lankans | 93.2 /100 | #106 | Exceptional 83.2% |
| Iranians | 92.9 /100 | #107 | Exceptional 83.2% |