Italian vs Portuguese Unemployment Among Ages 60 to 64 years
COMPARE
Italian
Portuguese
Unemployment Among Ages 60 to 64 years
Unemployment Among Ages 60 to 64 years Comparison
Italians
Portuguese
4.8%
UNEMPLOYMENT AMONG AGES 60 TO 64 YEARS
85.0/ 100
METRIC RATING
143rd/ 347
METRIC RANK
4.7%
UNEMPLOYMENT AMONG AGES 60 TO 64 YEARS
97.9/ 100
METRIC RATING
100th/ 347
METRIC RANK
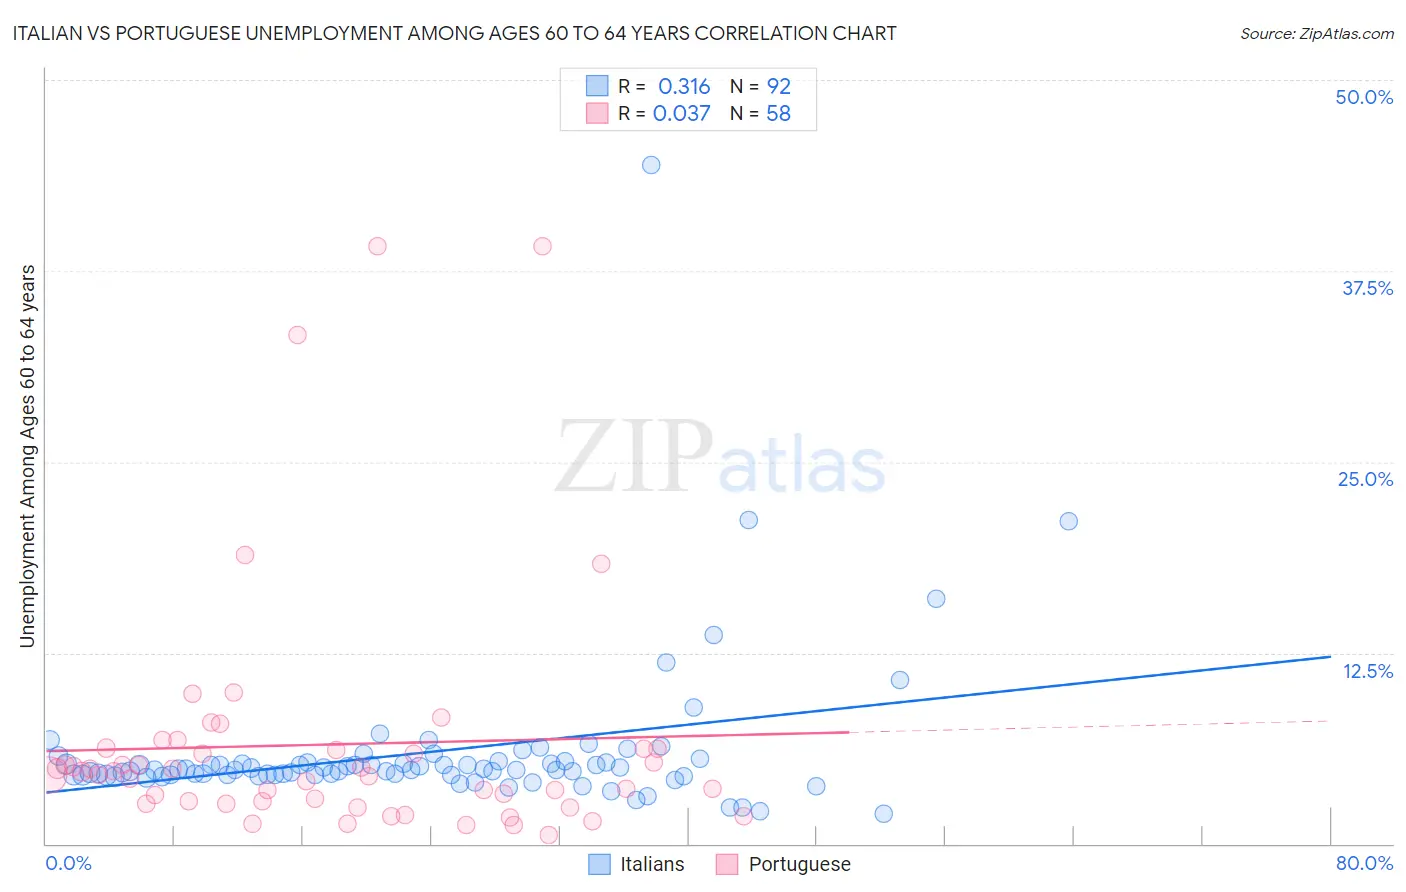
Italian vs Portuguese Unemployment Among Ages 60 to 64 years Correlation Chart
The statistical analysis conducted on geographies consisting of 467,885,151 people shows a mild positive correlation between the proportion of Italians and unemployment rate among population between the ages 60 and 64 in the United States with a correlation coefficient (R) of 0.316 and weighted average of 4.8%. Similarly, the statistical analysis conducted on geographies consisting of 398,687,122 people shows no correlation between the proportion of Portuguese and unemployment rate among population between the ages 60 and 64 in the United States with a correlation coefficient (R) of 0.037 and weighted average of 4.7%, a difference of 1.9%.
Unemployment Among Ages 60 to 64 years Correlation Summary
| Measurement | Italian | Portuguese |
| Minimum | 2.0% | 0.60% |
| Maximum | 44.4% | 39.1% |
| Range | 42.4% | 38.5% |
| Mean | 6.0% | 6.5% |
| Median | 4.8% | 4.6% |
| Interquartile 25% (IQ1) | 4.5% | 2.8% |
| Interquartile 75% (IQ3) | 5.3% | 6.2% |
| Interquartile Range (IQR) | 0.80% | 3.4% |
| Standard Deviation (Sample) | 5.1% | 8.0% |
| Standard Deviation (Population) | 5.1% | 7.9% |
Similar Demographics by Unemployment Among Ages 60 to 64 years
Demographics Similar to Italians by Unemployment Among Ages 60 to 64 years
In terms of unemployment among ages 60 to 64 years, the demographic groups most similar to Italians are Immigrants from Ethiopia (4.8%, a difference of 0.020%), Panamanian (4.8%, a difference of 0.030%), Pima (4.8%, a difference of 0.060%), Immigrants from Pakistan (4.8%, a difference of 0.11%), and Immigrants from Lithuania (4.8%, a difference of 0.12%).
| Demographics | Rating | Rank | Unemployment Among Ages 60 to 64 years |
| French Canadians | 87.6 /100 | #136 | Excellent 4.8% |
| Cambodians | 86.9 /100 | #137 | Excellent 4.8% |
| Immigrants | Lithuania | 86.7 /100 | #138 | Excellent 4.8% |
| Immigrants | Africa | 86.6 /100 | #139 | Excellent 4.8% |
| Pima | 85.8 /100 | #140 | Excellent 4.8% |
| Panamanians | 85.5 /100 | #141 | Excellent 4.8% |
| Immigrants | Ethiopia | 85.3 /100 | #142 | Excellent 4.8% |
| Italians | 85.0 /100 | #143 | Excellent 4.8% |
| Immigrants | Pakistan | 83.3 /100 | #144 | Excellent 4.8% |
| Burmese | 83.1 /100 | #145 | Excellent 4.8% |
| Turks | 81.9 /100 | #146 | Excellent 4.8% |
| Mongolians | 81.2 /100 | #147 | Excellent 4.8% |
| Latvians | 79.1 /100 | #148 | Good 4.8% |
| Arabs | 78.8 /100 | #149 | Good 4.8% |
| Immigrants | Italy | 78.7 /100 | #150 | Good 4.8% |
Demographics Similar to Portuguese by Unemployment Among Ages 60 to 64 years
In terms of unemployment among ages 60 to 64 years, the demographic groups most similar to Portuguese are Malaysian (4.7%, a difference of 0.0%), Immigrants from Canada (4.7%, a difference of 0.020%), Egyptian (4.7%, a difference of 0.030%), White/Caucasian (4.7%, a difference of 0.030%), and Immigrants from Albania (4.7%, a difference of 0.040%).
| Demographics | Rating | Rank | Unemployment Among Ages 60 to 64 years |
| Immigrants | Saudi Arabia | 98.3 /100 | #93 | Exceptional 4.7% |
| Immigrants | Kuwait | 98.3 /100 | #94 | Exceptional 4.7% |
| Serbians | 98.2 /100 | #95 | Exceptional 4.7% |
| Poles | 98.1 /100 | #96 | Exceptional 4.7% |
| Immigrants | Albania | 98.0 /100 | #97 | Exceptional 4.7% |
| Somalis | 98.0 /100 | #98 | Exceptional 4.7% |
| Egyptians | 98.0 /100 | #99 | Exceptional 4.7% |
| Portuguese | 97.9 /100 | #100 | Exceptional 4.7% |
| Malaysians | 97.9 /100 | #101 | Exceptional 4.7% |
| Immigrants | Canada | 97.8 /100 | #102 | Exceptional 4.7% |
| Whites/Caucasians | 97.8 /100 | #103 | Exceptional 4.7% |
| Paraguayans | 97.7 /100 | #104 | Exceptional 4.7% |
| Canadians | 97.7 /100 | #105 | Exceptional 4.7% |
| Immigrants | North America | 97.6 /100 | #106 | Exceptional 4.7% |
| Greeks | 97.5 /100 | #107 | Exceptional 4.7% |