Iroquois vs Immigrants from Afghanistan In Labor Force | Age > 16
COMPARE
Iroquois
Immigrants from Afghanistan
In Labor Force | Age > 16
In Labor Force | Age > 16 Comparison
Iroquois
Immigrants from Afghanistan
63.2%
IN LABOR FORCE | AGE > 16
0.0/ 100
METRIC RATING
312th/ 347
METRIC RANK
67.0%
IN LABOR FORCE | AGE > 16
100.0/ 100
METRIC RATING
37th/ 347
METRIC RANK
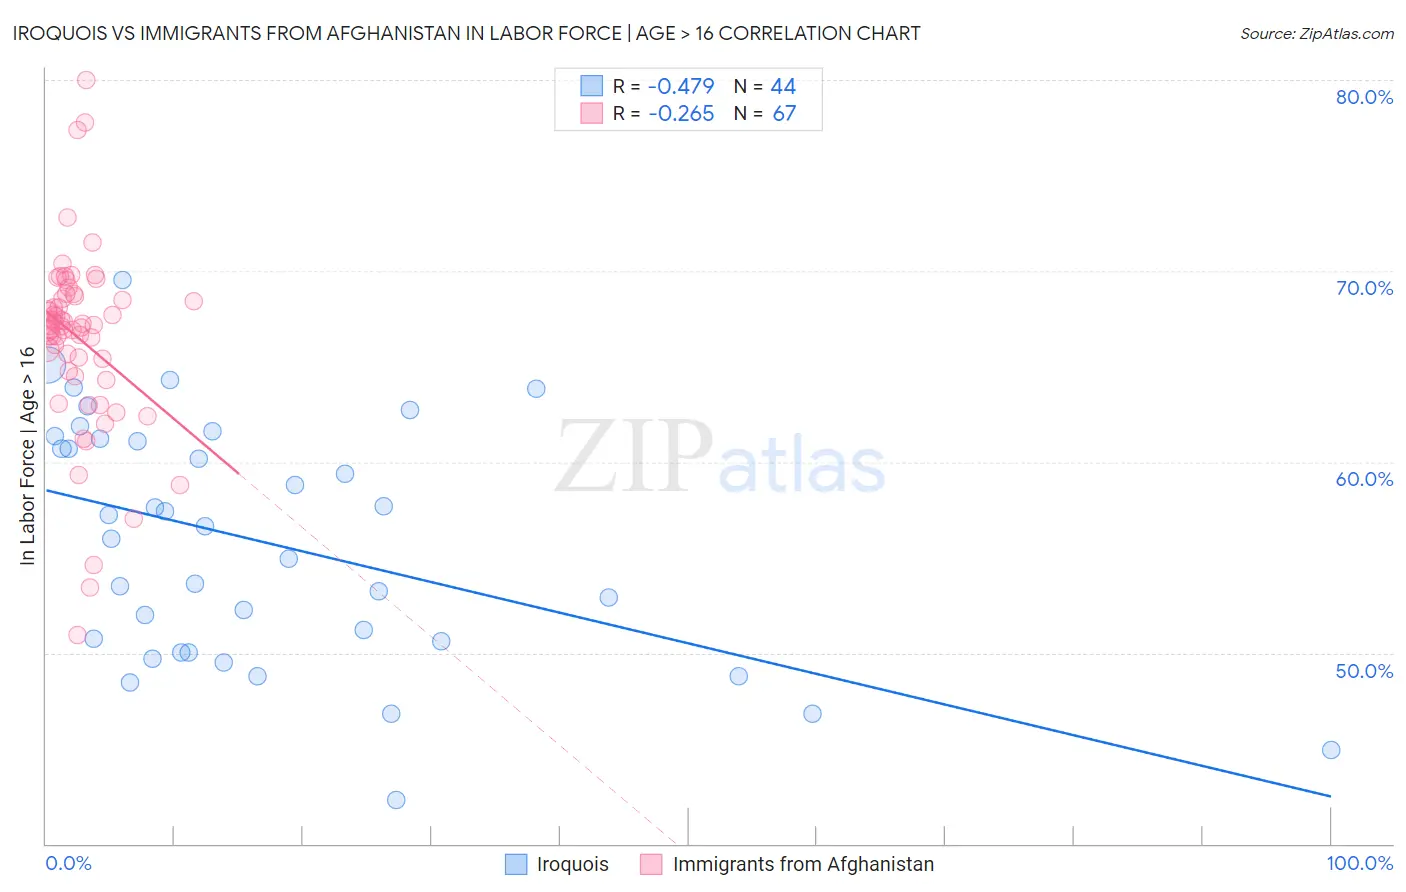
Iroquois vs Immigrants from Afghanistan In Labor Force | Age > 16 Correlation Chart
The statistical analysis conducted on geographies consisting of 207,293,305 people shows a moderate negative correlation between the proportion of Iroquois and labor force participation rate among population ages 16 and over in the United States with a correlation coefficient (R) of -0.479 and weighted average of 63.2%. Similarly, the statistical analysis conducted on geographies consisting of 147,646,039 people shows a weak negative correlation between the proportion of Immigrants from Afghanistan and labor force participation rate among population ages 16 and over in the United States with a correlation coefficient (R) of -0.265 and weighted average of 67.0%, a difference of 6.0%.
In Labor Force | Age > 16 Correlation Summary
| Measurement | Iroquois | Immigrants from Afghanistan |
| Minimum | 42.3% | 50.9% |
| Maximum | 69.6% | 80.0% |
| Range | 27.3% | 29.1% |
| Mean | 55.7% | 66.5% |
| Median | 56.3% | 67.1% |
| Interquartile 25% (IQ1) | 50.3% | 64.7% |
| Interquartile 75% (IQ3) | 61.2% | 68.7% |
| Interquartile Range (IQR) | 10.9% | 4.0% |
| Standard Deviation (Sample) | 6.3% | 4.8% |
| Standard Deviation (Population) | 6.3% | 4.8% |
Similar Demographics by In Labor Force | Age > 16
Demographics Similar to Iroquois by In Labor Force | Age > 16
In terms of in labor force | age > 16, the demographic groups most similar to Iroquois are Blackfeet (63.2%, a difference of 0.060%), Shoshone (63.2%, a difference of 0.070%), Chippewa (63.1%, a difference of 0.13%), Scotch-Irish (63.3%, a difference of 0.14%), and Yaqui (63.0%, a difference of 0.23%).
| Demographics | Rating | Rank | In Labor Force | Age > 16 |
| Osage | 0.0 /100 | #305 | Tragic 63.5% |
| Blacks/African Americans | 0.0 /100 | #306 | Tragic 63.4% |
| Central American Indians | 0.0 /100 | #307 | Tragic 63.4% |
| Pennsylvania Germans | 0.0 /100 | #308 | Tragic 63.4% |
| Scotch-Irish | 0.0 /100 | #309 | Tragic 63.3% |
| Shoshone | 0.0 /100 | #310 | Tragic 63.2% |
| Blackfeet | 0.0 /100 | #311 | Tragic 63.2% |
| Iroquois | 0.0 /100 | #312 | Tragic 63.2% |
| Chippewa | 0.0 /100 | #313 | Tragic 63.1% |
| Yaqui | 0.0 /100 | #314 | Tragic 63.0% |
| Potawatomi | 0.0 /100 | #315 | Tragic 62.8% |
| Yup'ik | 0.0 /100 | #316 | Tragic 62.7% |
| Kiowa | 0.0 /100 | #317 | Tragic 62.4% |
| Chickasaw | 0.0 /100 | #318 | Tragic 62.3% |
| Arapaho | 0.0 /100 | #319 | Tragic 62.1% |
Demographics Similar to Immigrants from Afghanistan by In Labor Force | Age > 16
In terms of in labor force | age > 16, the demographic groups most similar to Immigrants from Afghanistan are Immigrants from South Central Asia (67.1%, a difference of 0.080%), Immigrants from Western Africa (67.1%, a difference of 0.080%), Immigrants from Nigeria (66.9%, a difference of 0.12%), Immigrants from Ghana (67.1%, a difference of 0.13%), and Immigrants from Congo (67.1%, a difference of 0.14%).
| Demographics | Rating | Rank | In Labor Force | Age > 16 |
| Immigrants | Zaire | 100.0 /100 | #30 | Exceptional 67.2% |
| Ghanaians | 100.0 /100 | #31 | Exceptional 67.1% |
| Immigrants | Congo | 100.0 /100 | #32 | Exceptional 67.1% |
| Afghans | 100.0 /100 | #33 | Exceptional 67.1% |
| Immigrants | Ghana | 100.0 /100 | #34 | Exceptional 67.1% |
| Immigrants | South Central Asia | 100.0 /100 | #35 | Exceptional 67.1% |
| Immigrants | Western Africa | 100.0 /100 | #36 | Exceptional 67.1% |
| Immigrants | Afghanistan | 100.0 /100 | #37 | Exceptional 67.0% |
| Immigrants | Nigeria | 100.0 /100 | #38 | Exceptional 66.9% |
| Salvadorans | 100.0 /100 | #39 | Exceptional 66.8% |
| Immigrants | El Salvador | 100.0 /100 | #40 | Exceptional 66.8% |
| Immigrants | Zimbabwe | 100.0 /100 | #41 | Exceptional 66.8% |
| Senegalese | 100.0 /100 | #42 | Exceptional 66.7% |
| Luxembourgers | 100.0 /100 | #43 | Exceptional 66.7% |
| Immigrants | Pakistan | 100.0 /100 | #44 | Exceptional 66.7% |