Iroquois vs Bhutanese In Labor Force | Age 30-34
COMPARE
Iroquois
Bhutanese
In Labor Force | Age 30-34
In Labor Force | Age 30-34 Comparison
Iroquois
Bhutanese
81.9%
IN LABOR FORCE | AGE 30-34
0.0/ 100
METRIC RATING
313th/ 347
METRIC RANK
85.0%
IN LABOR FORCE | AGE 30-34
87.5/ 100
METRIC RATING
139th/ 347
METRIC RANK
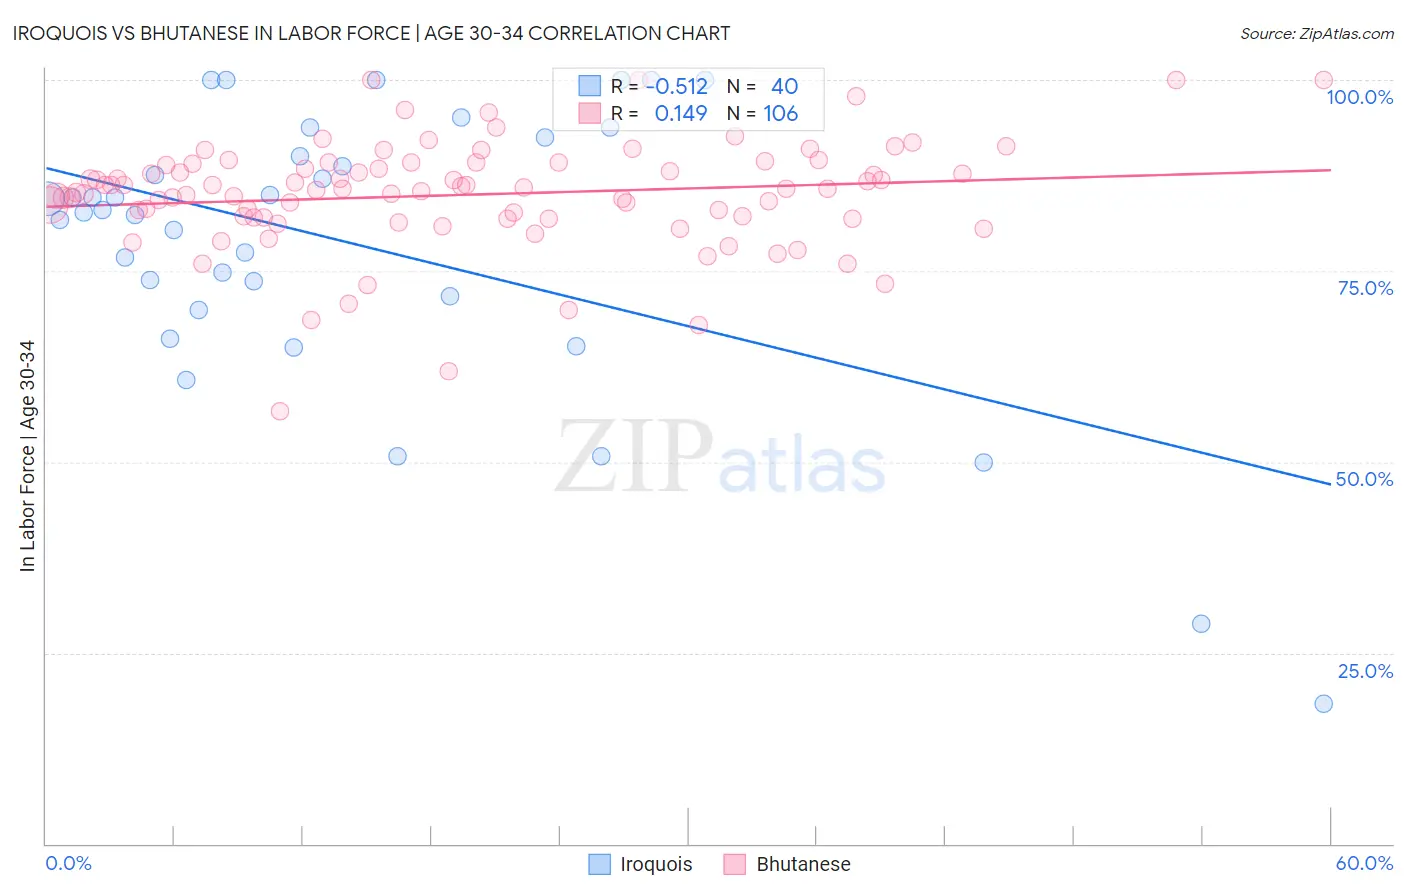
Iroquois vs Bhutanese In Labor Force | Age 30-34 Correlation Chart
The statistical analysis conducted on geographies consisting of 207,240,076 people shows a substantial negative correlation between the proportion of Iroquois and labor force participation rate among population between the ages 30 and 34 in the United States with a correlation coefficient (R) of -0.512 and weighted average of 81.9%. Similarly, the statistical analysis conducted on geographies consisting of 455,199,053 people shows a poor positive correlation between the proportion of Bhutanese and labor force participation rate among population between the ages 30 and 34 in the United States with a correlation coefficient (R) of 0.149 and weighted average of 85.0%, a difference of 3.7%.
In Labor Force | Age 30-34 Correlation Summary
| Measurement | Iroquois | Bhutanese |
| Minimum | 18.3% | 56.7% |
| Maximum | 100.0% | 100.0% |
| Range | 81.7% | 43.3% |
| Mean | 78.4% | 85.0% |
| Median | 82.8% | 85.7% |
| Interquartile 25% (IQ1) | 70.7% | 82.0% |
| Interquartile 75% (IQ3) | 91.2% | 89.0% |
| Interquartile Range (IQR) | 20.5% | 7.0% |
| Standard Deviation (Sample) | 18.8% | 7.2% |
| Standard Deviation (Population) | 18.6% | 7.1% |
Similar Demographics by In Labor Force | Age 30-34
Demographics Similar to Iroquois by In Labor Force | Age 30-34
In terms of in labor force | age 30-34, the demographic groups most similar to Iroquois are Chickasaw (81.9%, a difference of 0.020%), Mexican (81.9%, a difference of 0.020%), Cajun (82.0%, a difference of 0.070%), Immigrants from Mexico (82.0%, a difference of 0.10%), and Alaskan Athabascan (81.7%, a difference of 0.25%).
| Demographics | Rating | Rank | In Labor Force | Age 30-34 |
| Spanish American Indians | 0.0 /100 | #306 | Tragic 82.2% |
| Menominee | 0.0 /100 | #307 | Tragic 82.2% |
| Puget Sound Salish | 0.0 /100 | #308 | Tragic 82.1% |
| Immigrants | Mexico | 0.0 /100 | #309 | Tragic 82.0% |
| Cajuns | 0.0 /100 | #310 | Tragic 82.0% |
| Chickasaw | 0.0 /100 | #311 | Tragic 81.9% |
| Mexicans | 0.0 /100 | #312 | Tragic 81.9% |
| Iroquois | 0.0 /100 | #313 | Tragic 81.9% |
| Alaskan Athabascans | 0.0 /100 | #314 | Tragic 81.7% |
| Cherokee | 0.0 /100 | #315 | Tragic 81.6% |
| Immigrants | Azores | 0.0 /100 | #316 | Tragic 81.5% |
| Arapaho | 0.0 /100 | #317 | Tragic 81.5% |
| Choctaw | 0.0 /100 | #318 | Tragic 81.4% |
| Shoshone | 0.0 /100 | #319 | Tragic 81.4% |
| Yaqui | 0.0 /100 | #320 | Tragic 81.4% |
Demographics Similar to Bhutanese by In Labor Force | Age 30-34
In terms of in labor force | age 30-34, the demographic groups most similar to Bhutanese are South African (85.0%, a difference of 0.010%), Sri Lankan (85.0%, a difference of 0.010%), Immigrants from Asia (85.0%, a difference of 0.020%), Jordanian (85.0%, a difference of 0.020%), and Immigrants from Vietnam (85.0%, a difference of 0.020%).
| Demographics | Rating | Rank | In Labor Force | Age 30-34 |
| Immigrants | Israel | 89.5 /100 | #132 | Excellent 85.0% |
| New Zealanders | 89.5 /100 | #133 | Excellent 85.0% |
| Immigrants | Chile | 89.2 /100 | #134 | Excellent 85.0% |
| Immigrants | Asia | 88.9 /100 | #135 | Excellent 85.0% |
| Jordanians | 88.6 /100 | #136 | Excellent 85.0% |
| South Africans | 88.0 /100 | #137 | Excellent 85.0% |
| Sri Lankans | 87.8 /100 | #138 | Excellent 85.0% |
| Bhutanese | 87.5 /100 | #139 | Excellent 85.0% |
| Immigrants | Vietnam | 86.5 /100 | #140 | Excellent 85.0% |
| Chileans | 85.3 /100 | #141 | Excellent 84.9% |
| Immigrants | Indonesia | 84.3 /100 | #142 | Excellent 84.9% |
| Colombians | 82.2 /100 | #143 | Excellent 84.9% |
| Uruguayans | 78.5 /100 | #144 | Good 84.9% |
| Palestinians | 77.7 /100 | #145 | Good 84.9% |
| Immigrants | Saudi Arabia | 76.6 /100 | #146 | Good 84.9% |