Iroquois vs Cajun In Labor Force | Age 30-34
COMPARE
Iroquois
Cajun
In Labor Force | Age 30-34
In Labor Force | Age 30-34 Comparison
Iroquois
Cajuns
81.9%
IN LABOR FORCE | AGE 30-34
0.0/ 100
METRIC RATING
313th/ 347
METRIC RANK
82.0%
IN LABOR FORCE | AGE 30-34
0.0/ 100
METRIC RATING
310th/ 347
METRIC RANK
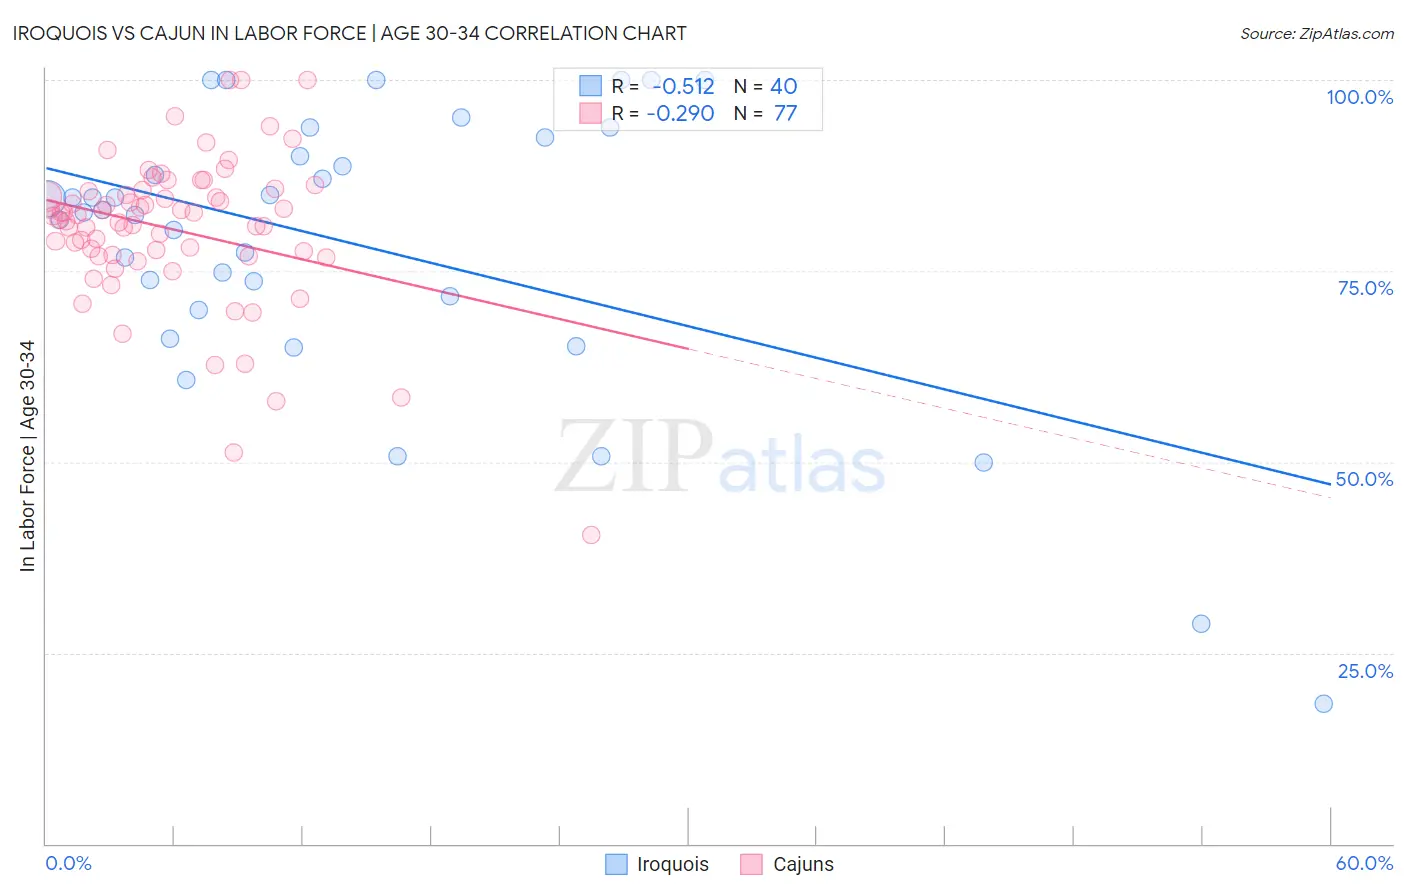
Iroquois vs Cajun In Labor Force | Age 30-34 Correlation Chart
The statistical analysis conducted on geographies consisting of 207,240,076 people shows a substantial negative correlation between the proportion of Iroquois and labor force participation rate among population between the ages 30 and 34 in the United States with a correlation coefficient (R) of -0.512 and weighted average of 81.9%. Similarly, the statistical analysis conducted on geographies consisting of 149,688,268 people shows a weak negative correlation between the proportion of Cajuns and labor force participation rate among population between the ages 30 and 34 in the United States with a correlation coefficient (R) of -0.290 and weighted average of 82.0%, a difference of 0.070%.
In Labor Force | Age 30-34 Correlation Summary
| Measurement | Iroquois | Cajun |
| Minimum | 18.3% | 40.5% |
| Maximum | 100.0% | 100.0% |
| Range | 81.7% | 59.5% |
| Mean | 78.4% | 80.4% |
| Median | 82.8% | 82.2% |
| Interquartile 25% (IQ1) | 70.7% | 77.0% |
| Interquartile 75% (IQ3) | 91.2% | 85.6% |
| Interquartile Range (IQR) | 20.5% | 8.6% |
| Standard Deviation (Sample) | 18.8% | 10.0% |
| Standard Deviation (Population) | 18.6% | 9.9% |
Demographics Similar to Iroquois and Cajuns by In Labor Force | Age 30-34
In terms of in labor force | age 30-34, the demographic groups most similar to Iroquois are Chickasaw (81.9%, a difference of 0.020%), Mexican (81.9%, a difference of 0.020%), Immigrants from Mexico (82.0%, a difference of 0.10%), Alaskan Athabascan (81.7%, a difference of 0.25%), and Puget Sound Salish (82.1%, a difference of 0.26%). Similarly, the demographic groups most similar to Cajuns are Immigrants from Mexico (82.0%, a difference of 0.020%), Chickasaw (81.9%, a difference of 0.050%), Mexican (81.9%, a difference of 0.050%), Puget Sound Salish (82.1%, a difference of 0.19%), and Menominee (82.2%, a difference of 0.28%).
| Demographics | Rating | Rank | In Labor Force | Age 30-34 |
| Hispanics or Latinos | 0.0 /100 | #301 | Tragic 82.4% |
| Ottawa | 0.0 /100 | #302 | Tragic 82.4% |
| Immigrants | Micronesia | 0.0 /100 | #303 | Tragic 82.4% |
| Tlingit-Haida | 0.0 /100 | #304 | Tragic 82.3% |
| Osage | 0.0 /100 | #305 | Tragic 82.3% |
| Spanish American Indians | 0.0 /100 | #306 | Tragic 82.2% |
| Menominee | 0.0 /100 | #307 | Tragic 82.2% |
| Puget Sound Salish | 0.0 /100 | #308 | Tragic 82.1% |
| Immigrants | Mexico | 0.0 /100 | #309 | Tragic 82.0% |
| Cajuns | 0.0 /100 | #310 | Tragic 82.0% |
| Chickasaw | 0.0 /100 | #311 | Tragic 81.9% |
| Mexicans | 0.0 /100 | #312 | Tragic 81.9% |
| Iroquois | 0.0 /100 | #313 | Tragic 81.9% |
| Alaskan Athabascans | 0.0 /100 | #314 | Tragic 81.7% |
| Cherokee | 0.0 /100 | #315 | Tragic 81.6% |
| Immigrants | Azores | 0.0 /100 | #316 | Tragic 81.5% |
| Arapaho | 0.0 /100 | #317 | Tragic 81.5% |
| Choctaw | 0.0 /100 | #318 | Tragic 81.4% |
| Shoshone | 0.0 /100 | #319 | Tragic 81.4% |
| Yaqui | 0.0 /100 | #320 | Tragic 81.4% |
| Alaska Natives | 0.0 /100 | #321 | Tragic 81.3% |