Irish vs Yuman In Labor Force | Age 35-44
COMPARE
Irish
Yuman
In Labor Force | Age 35-44
In Labor Force | Age 35-44 Comparison
Irish
Yuman
84.4%
IN LABOR FORCE | AGE 35-44
53.1/ 100
METRIC RATING
168th/ 347
METRIC RANK
74.7%
IN LABOR FORCE | AGE 35-44
0.0/ 100
METRIC RATING
345th/ 347
METRIC RANK
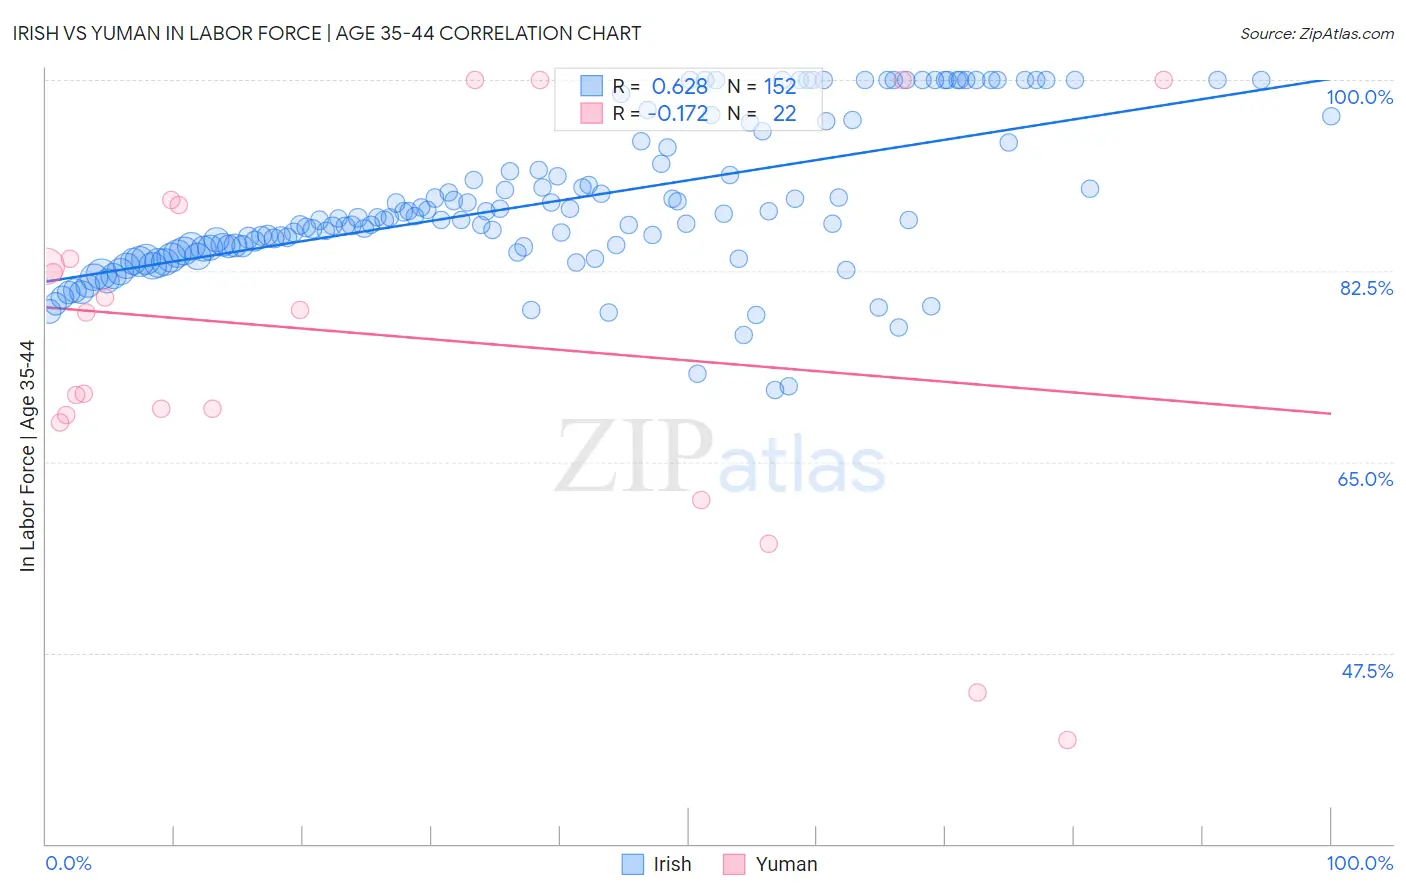
Irish vs Yuman In Labor Force | Age 35-44 Correlation Chart
The statistical analysis conducted on geographies consisting of 579,649,730 people shows a significant positive correlation between the proportion of Irish and labor force participation rate among population between the ages 35 and 44 in the United States with a correlation coefficient (R) of 0.628 and weighted average of 84.4%. Similarly, the statistical analysis conducted on geographies consisting of 40,681,124 people shows a poor negative correlation between the proportion of Yuman and labor force participation rate among population between the ages 35 and 44 in the United States with a correlation coefficient (R) of -0.172 and weighted average of 74.7%, a difference of 12.9%.
In Labor Force | Age 35-44 Correlation Summary
| Measurement | Irish | Yuman |
| Minimum | 71.6% | 39.5% |
| Maximum | 100.0% | 100.0% |
| Range | 28.4% | 60.5% |
| Mean | 88.8% | 76.7% |
| Median | 87.2% | 78.8% |
| Interquartile 25% (IQ1) | 84.4% | 69.3% |
| Interquartile 75% (IQ3) | 94.0% | 88.6% |
| Interquartile Range (IQR) | 9.6% | 19.3% |
| Standard Deviation (Sample) | 7.0% | 16.8% |
| Standard Deviation (Population) | 6.9% | 16.4% |
Similar Demographics by In Labor Force | Age 35-44
Demographics Similar to Irish by In Labor Force | Age 35-44
In terms of in labor force | age 35-44, the demographic groups most similar to Irish are Immigrants from Afghanistan (84.4%, a difference of 0.0%), Immigrants from Jordan (84.4%, a difference of 0.0%), Alsatian (84.4%, a difference of 0.010%), Immigrants from Portugal (84.4%, a difference of 0.010%), and Jordanian (84.4%, a difference of 0.010%).
| Demographics | Rating | Rank | In Labor Force | Age 35-44 |
| Immigrants | Venezuela | 60.0 /100 | #161 | Good 84.4% |
| Immigrants | Hungary | 59.4 /100 | #162 | Average 84.4% |
| Aleuts | 59.1 /100 | #163 | Average 84.4% |
| Nigerians | 58.9 /100 | #164 | Average 84.4% |
| Venezuelans | 58.1 /100 | #165 | Average 84.4% |
| Alsatians | 55.2 /100 | #166 | Average 84.4% |
| Immigrants | Portugal | 55.2 /100 | #167 | Average 84.4% |
| Irish | 53.1 /100 | #168 | Average 84.4% |
| Immigrants | Afghanistan | 52.7 /100 | #169 | Average 84.4% |
| Immigrants | Jordan | 52.5 /100 | #170 | Average 84.4% |
| Jordanians | 51.7 /100 | #171 | Average 84.4% |
| Scandinavians | 51.2 /100 | #172 | Average 84.4% |
| Immigrants | Trinidad and Tobago | 50.7 /100 | #173 | Average 84.4% |
| Immigrants | Iran | 50.0 /100 | #174 | Average 84.4% |
| Pakistanis | 48.2 /100 | #175 | Average 84.4% |
Demographics Similar to Yuman by In Labor Force | Age 35-44
In terms of in labor force | age 35-44, the demographic groups most similar to Yuman are Pima (74.8%, a difference of 0.13%), Tohono O'odham (74.1%, a difference of 0.83%), Navajo (73.8%, a difference of 1.2%), Immigrants from Yemen (76.3%, a difference of 2.1%), and Crow (76.5%, a difference of 2.3%).
| Demographics | Rating | Rank | In Labor Force | Age 35-44 |
| Kiowa | 0.0 /100 | #333 | Tragic 79.2% |
| Yakama | 0.0 /100 | #334 | Tragic 79.0% |
| Natives/Alaskans | 0.0 /100 | #335 | Tragic 78.9% |
| Arapaho | 0.0 /100 | #336 | Tragic 78.1% |
| Apache | 0.0 /100 | #337 | Tragic 77.9% |
| Pueblo | 0.0 /100 | #338 | Tragic 77.4% |
| Yup'ik | 0.0 /100 | #339 | Tragic 77.3% |
| Lumbee | 0.0 /100 | #340 | Tragic 77.0% |
| Hopi | 0.0 /100 | #341 | Tragic 77.0% |
| Crow | 0.0 /100 | #342 | Tragic 76.5% |
| Immigrants | Yemen | 0.0 /100 | #343 | Tragic 76.3% |
| Pima | 0.0 /100 | #344 | Tragic 74.8% |
| Yuman | 0.0 /100 | #345 | Tragic 74.7% |
| Tohono O'odham | 0.0 /100 | #346 | Tragic 74.1% |
| Navajo | 0.0 /100 | #347 | Tragic 73.8% |