Irish vs Lebanese In Labor Force | Age 30-34
COMPARE
Irish
Lebanese
In Labor Force | Age 30-34
In Labor Force | Age 30-34 Comparison
Irish
Lebanese
84.7%
IN LABOR FORCE | AGE 30-34
52.0/ 100
METRIC RATING
171st/ 347
METRIC RANK
84.4%
IN LABOR FORCE | AGE 30-34
10.6/ 100
METRIC RATING
206th/ 347
METRIC RANK
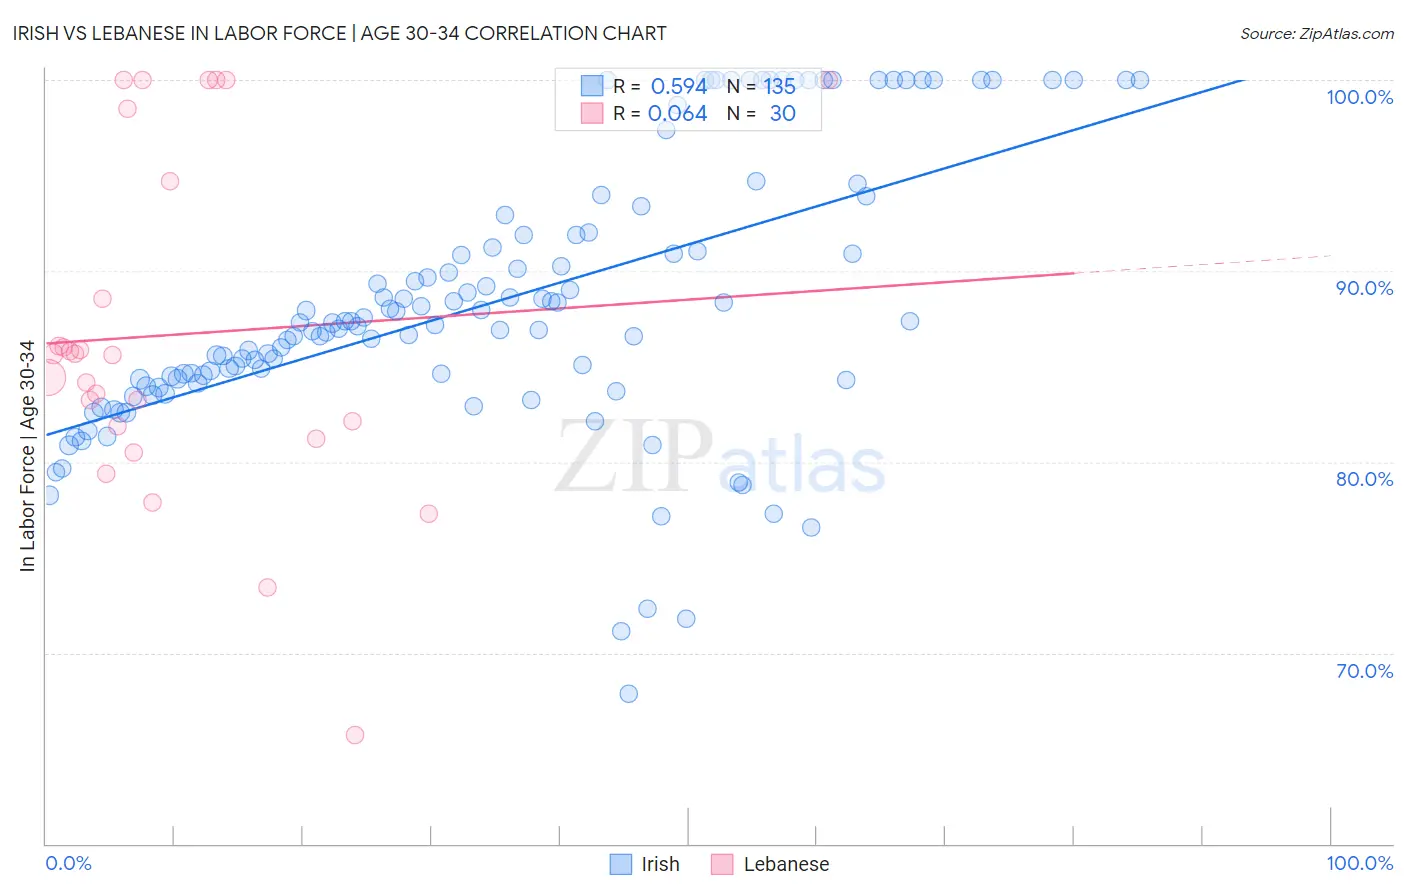
Irish vs Lebanese In Labor Force | Age 30-34 Correlation Chart
The statistical analysis conducted on geographies consisting of 578,567,964 people shows a substantial positive correlation between the proportion of Irish and labor force participation rate among population between the ages 30 and 34 in the United States with a correlation coefficient (R) of 0.594 and weighted average of 84.7%. Similarly, the statistical analysis conducted on geographies consisting of 401,295,457 people shows a slight positive correlation between the proportion of Lebanese and labor force participation rate among population between the ages 30 and 34 in the United States with a correlation coefficient (R) of 0.064 and weighted average of 84.4%, a difference of 0.39%.
In Labor Force | Age 30-34 Correlation Summary
| Measurement | Irish | Lebanese |
| Minimum | 67.8% | 65.7% |
| Maximum | 100.0% | 100.0% |
| Range | 32.2% | 34.3% |
| Mean | 88.3% | 86.7% |
| Median | 87.3% | 85.6% |
| Interquartile 25% (IQ1) | 84.3% | 81.8% |
| Interquartile 75% (IQ3) | 91.9% | 94.7% |
| Interquartile Range (IQR) | 7.6% | 12.9% |
| Standard Deviation (Sample) | 7.1% | 8.8% |
| Standard Deviation (Population) | 7.1% | 8.7% |
Similar Demographics by In Labor Force | Age 30-34
Demographics Similar to Irish by In Labor Force | Age 30-34
In terms of in labor force | age 30-34, the demographic groups most similar to Irish are Immigrants from Peru (84.7%, a difference of 0.0%), South American Indian (84.7%, a difference of 0.0%), Immigrants from Burma/Myanmar (84.7%, a difference of 0.0%), Immigrants from England (84.7%, a difference of 0.0%), and Israeli (84.7%, a difference of 0.010%).
| Demographics | Rating | Rank | In Labor Force | Age 30-34 |
| Icelanders | 56.8 /100 | #164 | Average 84.7% |
| Immigrants | Western Europe | 56.7 /100 | #165 | Average 84.7% |
| Afghans | 55.2 /100 | #166 | Average 84.7% |
| Immigrants | South Eastern Asia | 54.2 /100 | #167 | Average 84.7% |
| Immigrants | Peru | 52.4 /100 | #168 | Average 84.7% |
| South American Indians | 52.1 /100 | #169 | Average 84.7% |
| Immigrants | Burma/Myanmar | 52.0 /100 | #170 | Average 84.7% |
| Irish | 52.0 /100 | #171 | Average 84.7% |
| Immigrants | England | 51.7 /100 | #172 | Average 84.7% |
| Israelis | 51.1 /100 | #173 | Average 84.7% |
| Finns | 50.0 /100 | #174 | Average 84.7% |
| Immigrants | South America | 50.0 /100 | #175 | Average 84.7% |
| Immigrants | Uzbekistan | 49.1 /100 | #176 | Average 84.7% |
| Laotians | 46.9 /100 | #177 | Average 84.7% |
| Okinawans | 44.1 /100 | #178 | Average 84.6% |
Demographics Similar to Lebanese by In Labor Force | Age 30-34
In terms of in labor force | age 30-34, the demographic groups most similar to Lebanese are Bangladeshi (84.3%, a difference of 0.020%), Arab (84.3%, a difference of 0.030%), Jamaican (84.3%, a difference of 0.040%), Indonesian (84.3%, a difference of 0.040%), and Japanese (84.3%, a difference of 0.040%).
| Demographics | Rating | Rank | In Labor Force | Age 30-34 |
| Immigrants | Thailand | 19.1 /100 | #199 | Poor 84.5% |
| Sub-Saharan Africans | 19.0 /100 | #200 | Poor 84.5% |
| Trinidadians and Tobagonians | 18.2 /100 | #201 | Poor 84.5% |
| Immigrants | West Indies | 18.1 /100 | #202 | Poor 84.5% |
| Canadians | 15.4 /100 | #203 | Poor 84.4% |
| Ecuadorians | 14.2 /100 | #204 | Poor 84.4% |
| French | 13.8 /100 | #205 | Poor 84.4% |
| Lebanese | 10.6 /100 | #206 | Poor 84.4% |
| Bangladeshis | 9.4 /100 | #207 | Tragic 84.3% |
| Arabs | 8.9 /100 | #208 | Tragic 84.3% |
| Jamaicans | 8.8 /100 | #209 | Tragic 84.3% |
| Indonesians | 8.8 /100 | #210 | Tragic 84.3% |
| Japanese | 8.8 /100 | #211 | Tragic 84.3% |
| Immigrants | Western Asia | 8.2 /100 | #212 | Tragic 84.3% |
| Immigrants | Jamaica | 7.9 /100 | #213 | Tragic 84.3% |