Irish vs Danish In Labor Force | Age 30-34
COMPARE
Irish
Danish
In Labor Force | Age 30-34
In Labor Force | Age 30-34 Comparison
Irish
Danes
84.7%
IN LABOR FORCE | AGE 30-34
52.0/ 100
METRIC RATING
171st/ 347
METRIC RANK
84.3%
IN LABOR FORCE | AGE 30-34
5.3/ 100
METRIC RATING
220th/ 347
METRIC RANK
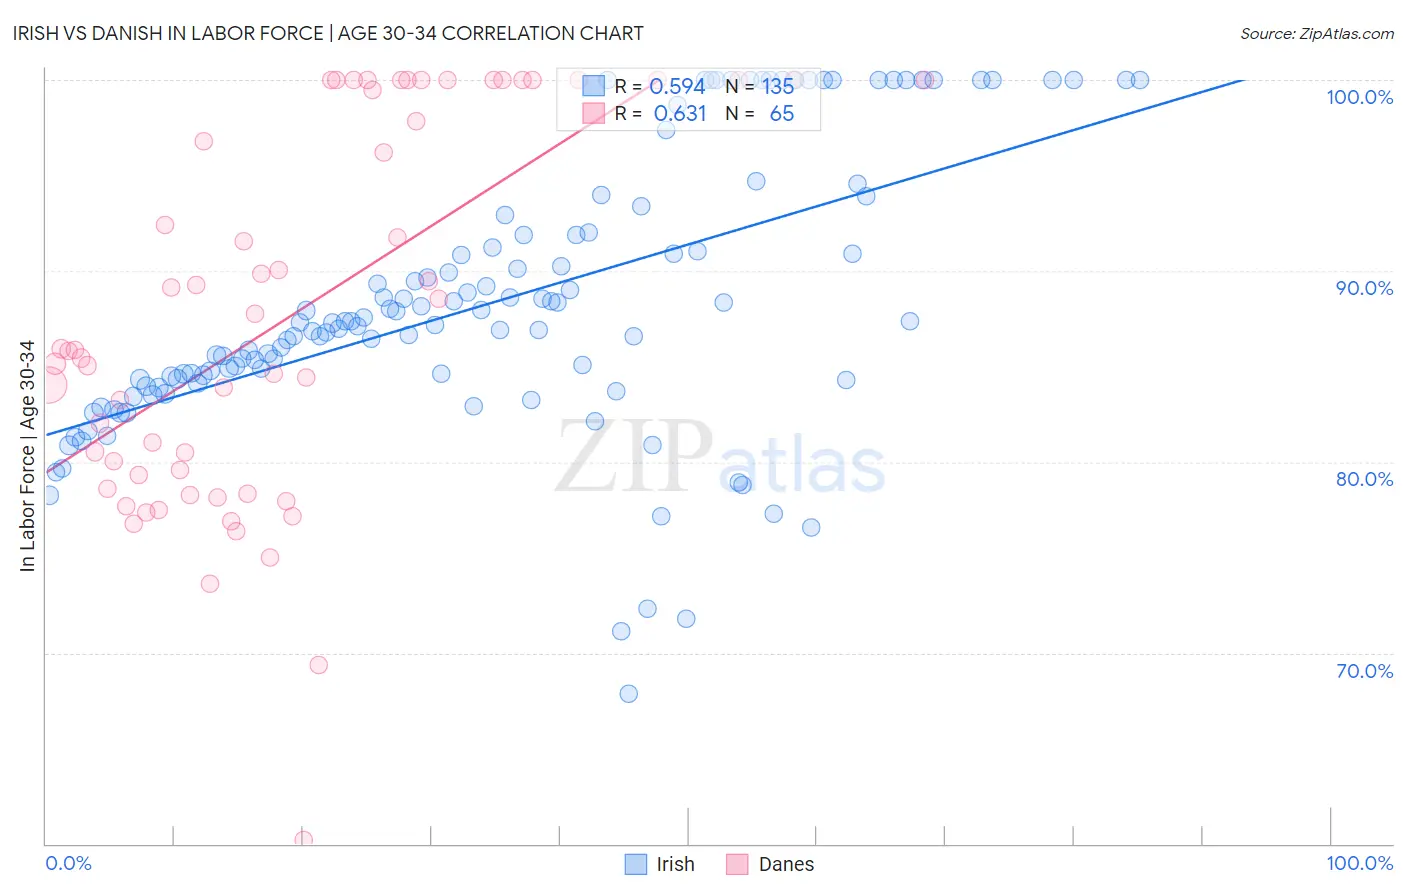
Irish vs Danish In Labor Force | Age 30-34 Correlation Chart
The statistical analysis conducted on geographies consisting of 578,567,964 people shows a substantial positive correlation between the proportion of Irish and labor force participation rate among population between the ages 30 and 34 in the United States with a correlation coefficient (R) of 0.594 and weighted average of 84.7%. Similarly, the statistical analysis conducted on geographies consisting of 473,662,566 people shows a significant positive correlation between the proportion of Danes and labor force participation rate among population between the ages 30 and 34 in the United States with a correlation coefficient (R) of 0.631 and weighted average of 84.3%, a difference of 0.52%.
In Labor Force | Age 30-34 Correlation Summary
| Measurement | Irish | Danish |
| Minimum | 67.8% | 60.2% |
| Maximum | 100.0% | 100.0% |
| Range | 32.2% | 39.8% |
| Mean | 88.3% | 87.6% |
| Median | 87.3% | 85.8% |
| Interquartile 25% (IQ1) | 84.3% | 79.0% |
| Interquartile 75% (IQ3) | 91.9% | 100.0% |
| Interquartile Range (IQR) | 7.6% | 21.0% |
| Standard Deviation (Sample) | 7.1% | 9.8% |
| Standard Deviation (Population) | 7.1% | 9.8% |
Similar Demographics by In Labor Force | Age 30-34
Demographics Similar to Irish by In Labor Force | Age 30-34
In terms of in labor force | age 30-34, the demographic groups most similar to Irish are Immigrants from Peru (84.7%, a difference of 0.0%), South American Indian (84.7%, a difference of 0.0%), Immigrants from Burma/Myanmar (84.7%, a difference of 0.0%), Immigrants from England (84.7%, a difference of 0.0%), and Israeli (84.7%, a difference of 0.010%).
| Demographics | Rating | Rank | In Labor Force | Age 30-34 |
| Icelanders | 56.8 /100 | #164 | Average 84.7% |
| Immigrants | Western Europe | 56.7 /100 | #165 | Average 84.7% |
| Afghans | 55.2 /100 | #166 | Average 84.7% |
| Immigrants | South Eastern Asia | 54.2 /100 | #167 | Average 84.7% |
| Immigrants | Peru | 52.4 /100 | #168 | Average 84.7% |
| South American Indians | 52.1 /100 | #169 | Average 84.7% |
| Immigrants | Burma/Myanmar | 52.0 /100 | #170 | Average 84.7% |
| Irish | 52.0 /100 | #171 | Average 84.7% |
| Immigrants | England | 51.7 /100 | #172 | Average 84.7% |
| Israelis | 51.1 /100 | #173 | Average 84.7% |
| Finns | 50.0 /100 | #174 | Average 84.7% |
| Immigrants | South America | 50.0 /100 | #175 | Average 84.7% |
| Immigrants | Uzbekistan | 49.1 /100 | #176 | Average 84.7% |
| Laotians | 46.9 /100 | #177 | Average 84.7% |
| Okinawans | 44.1 /100 | #178 | Average 84.6% |
Demographics Similar to Danes by In Labor Force | Age 30-34
In terms of in labor force | age 30-34, the demographic groups most similar to Danes are Swiss (84.3%, a difference of 0.020%), Immigrants from Panama (84.3%, a difference of 0.030%), Immigrants from Trinidad and Tobago (84.3%, a difference of 0.050%), Immigrants from Germany (84.3%, a difference of 0.060%), and European (84.3%, a difference of 0.060%).
| Demographics | Rating | Rank | In Labor Force | Age 30-34 |
| Immigrants | Jamaica | 7.9 /100 | #213 | Tragic 84.3% |
| Immigrants | Germany | 7.2 /100 | #214 | Tragic 84.3% |
| Europeans | 7.2 /100 | #215 | Tragic 84.3% |
| Immigrants | Ecuador | 7.1 /100 | #216 | Tragic 84.3% |
| Immigrants | Trinidad and Tobago | 7.0 /100 | #217 | Tragic 84.3% |
| Immigrants | Panama | 6.3 /100 | #218 | Tragic 84.3% |
| Swiss | 5.8 /100 | #219 | Tragic 84.3% |
| Danes | 5.3 /100 | #220 | Tragic 84.3% |
| Salvadorans | 3.8 /100 | #221 | Tragic 84.2% |
| Panamanians | 3.8 /100 | #222 | Tragic 84.2% |
| Immigrants | Laos | 3.6 /100 | #223 | Tragic 84.2% |
| Cubans | 3.4 /100 | #224 | Tragic 84.2% |
| Scottish | 3.1 /100 | #225 | Tragic 84.2% |
| Immigrants | El Salvador | 3.0 /100 | #226 | Tragic 84.2% |
| Immigrants | Cuba | 3.0 /100 | #227 | Tragic 84.2% |