Iraqi vs Senegalese In Labor Force | Age 20-24
COMPARE
Iraqi
Senegalese
In Labor Force | Age 20-24
In Labor Force | Age 20-24 Comparison
Iraqis
Senegalese
76.0%
IN LABOR FORCE | AGE 20-24
96.6/ 100
METRIC RATING
108th/ 347
METRIC RANK
74.8%
IN LABOR FORCE | AGE 20-24
28.1/ 100
METRIC RATING
191st/ 347
METRIC RANK
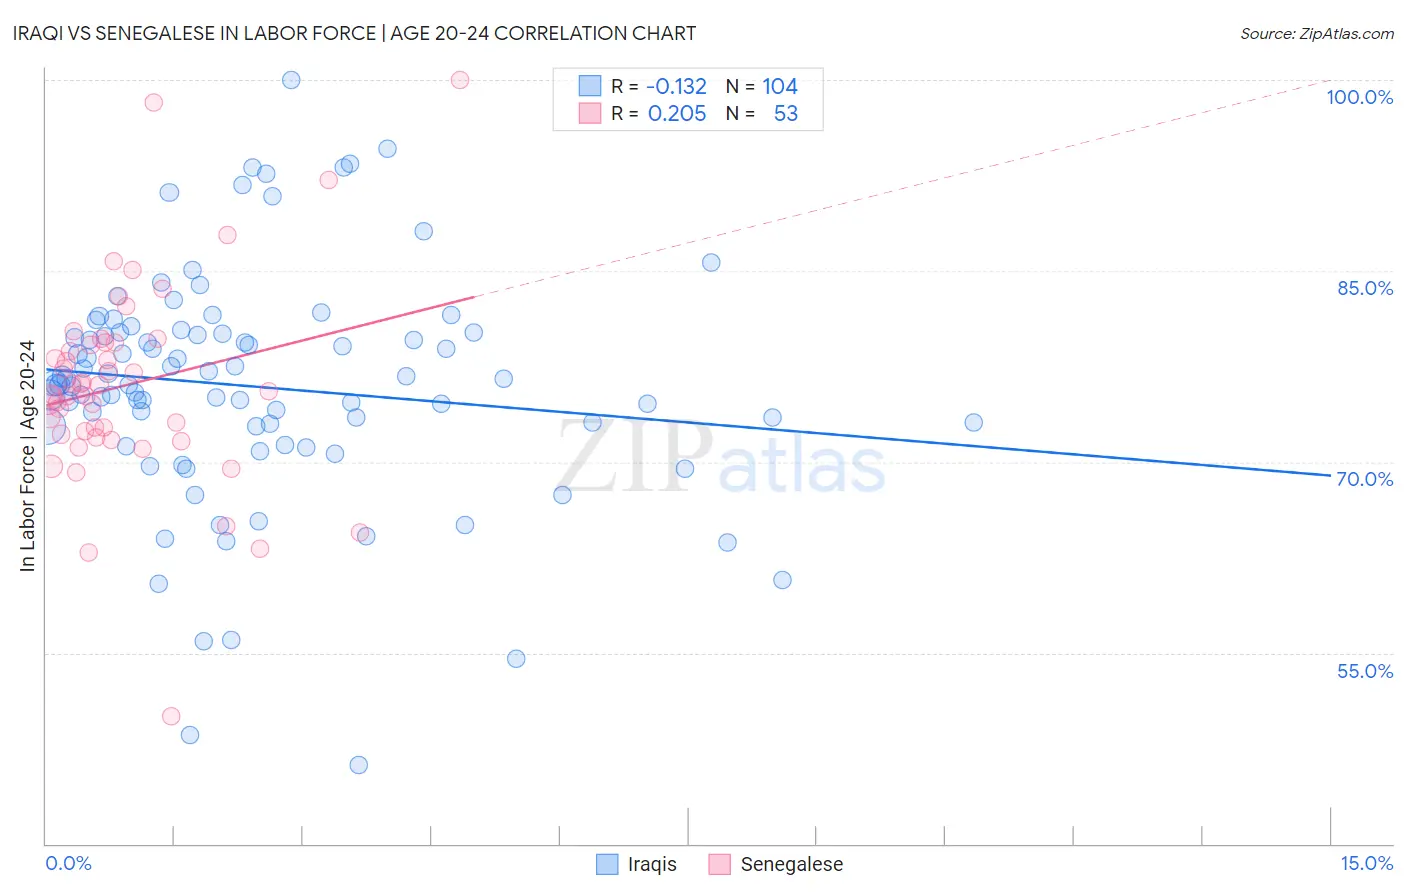
Iraqi vs Senegalese In Labor Force | Age 20-24 Correlation Chart
The statistical analysis conducted on geographies consisting of 170,641,378 people shows a poor negative correlation between the proportion of Iraqis and labor force participation rate among population between the ages 20 and 24 in the United States with a correlation coefficient (R) of -0.132 and weighted average of 76.0%. Similarly, the statistical analysis conducted on geographies consisting of 78,141,567 people shows a weak positive correlation between the proportion of Senegalese and labor force participation rate among population between the ages 20 and 24 in the United States with a correlation coefficient (R) of 0.205 and weighted average of 74.8%, a difference of 1.6%.
In Labor Force | Age 20-24 Correlation Summary
| Measurement | Iraqi | Senegalese |
| Minimum | 46.2% | 50.0% |
| Maximum | 100.0% | 100.0% |
| Range | 53.8% | 50.0% |
| Mean | 75.9% | 76.1% |
| Median | 76.1% | 75.5% |
| Interquartile 25% (IQ1) | 72.8% | 72.0% |
| Interquartile 75% (IQ3) | 80.1% | 79.4% |
| Interquartile Range (IQR) | 7.3% | 7.4% |
| Standard Deviation (Sample) | 9.1% | 8.2% |
| Standard Deviation (Population) | 9.1% | 8.1% |
Similar Demographics by In Labor Force | Age 20-24
Demographics Similar to Iraqis by In Labor Force | Age 20-24
In terms of in labor force | age 20-24, the demographic groups most similar to Iraqis are Greek (76.0%, a difference of 0.030%), Immigrants from Uganda (76.0%, a difference of 0.060%), Macedonian (76.0%, a difference of 0.070%), Immigrants from Nepal (76.0%, a difference of 0.070%), and Cherokee (75.9%, a difference of 0.080%).
| Demographics | Rating | Rank | In Labor Force | Age 20-24 |
| Immigrants | Poland | 97.7 /100 | #101 | Exceptional 76.1% |
| Latvians | 97.6 /100 | #102 | Exceptional 76.1% |
| Immigrants | North Macedonia | 97.5 /100 | #103 | Exceptional 76.1% |
| Macedonians | 97.2 /100 | #104 | Exceptional 76.0% |
| Immigrants | Nepal | 97.2 /100 | #105 | Exceptional 76.0% |
| Immigrants | Uganda | 97.1 /100 | #106 | Exceptional 76.0% |
| Greeks | 96.9 /100 | #107 | Exceptional 76.0% |
| Iraqis | 96.6 /100 | #108 | Exceptional 76.0% |
| Cherokee | 95.8 /100 | #109 | Exceptional 75.9% |
| Immigrants | Morocco | 95.8 /100 | #110 | Exceptional 75.9% |
| Ukrainians | 95.7 /100 | #111 | Exceptional 75.9% |
| Immigrants | Canada | 95.6 /100 | #112 | Exceptional 75.9% |
| Immigrants | Netherlands | 95.3 /100 | #113 | Exceptional 75.9% |
| Immigrants | Zimbabwe | 95.1 /100 | #114 | Exceptional 75.9% |
| Alaska Natives | 95.1 /100 | #115 | Exceptional 75.9% |
Demographics Similar to Senegalese by In Labor Force | Age 20-24
In terms of in labor force | age 20-24, the demographic groups most similar to Senegalese are Immigrants from Europe (74.8%, a difference of 0.010%), Alsatian (74.8%, a difference of 0.020%), Immigrants from Denmark (74.8%, a difference of 0.040%), Eastern European (74.8%, a difference of 0.050%), and Immigrants from Vietnam (74.7%, a difference of 0.060%).
| Demographics | Rating | Rank | In Labor Force | Age 20-24 |
| Immigrants | Hungary | 35.0 /100 | #184 | Fair 74.9% |
| Sri Lankans | 34.9 /100 | #185 | Fair 74.9% |
| Immigrants | Eastern Europe | 33.8 /100 | #186 | Fair 74.9% |
| Immigrants | Honduras | 33.5 /100 | #187 | Fair 74.9% |
| Hondurans | 32.7 /100 | #188 | Fair 74.8% |
| Immigrants | Northern Europe | 32.6 /100 | #189 | Fair 74.8% |
| Russians | 32.2 /100 | #190 | Fair 74.8% |
| Senegalese | 28.1 /100 | #191 | Fair 74.8% |
| Immigrants | Europe | 27.5 /100 | #192 | Fair 74.8% |
| Alsatians | 27.1 /100 | #193 | Fair 74.8% |
| Immigrants | Denmark | 25.8 /100 | #194 | Fair 74.8% |
| Eastern Europeans | 25.4 /100 | #195 | Fair 74.8% |
| Immigrants | Vietnam | 25.1 /100 | #196 | Fair 74.7% |
| Panamanians | 25.0 /100 | #197 | Fair 74.7% |
| Immigrants | Nigeria | 24.2 /100 | #198 | Fair 74.7% |