Immigrants from Kenya vs Immigrants from Liberia In Labor Force | Age 35-44
COMPARE
Immigrants from Kenya
Immigrants from Liberia
In Labor Force | Age 35-44
In Labor Force | Age 35-44 Comparison
Immigrants from Kenya
Immigrants from Liberia
85.1%
IN LABOR FORCE | AGE 35-44
99.6/ 100
METRIC RATING
52nd/ 347
METRIC RANK
85.4%
IN LABOR FORCE | AGE 35-44
99.9/ 100
METRIC RATING
26th/ 347
METRIC RANK
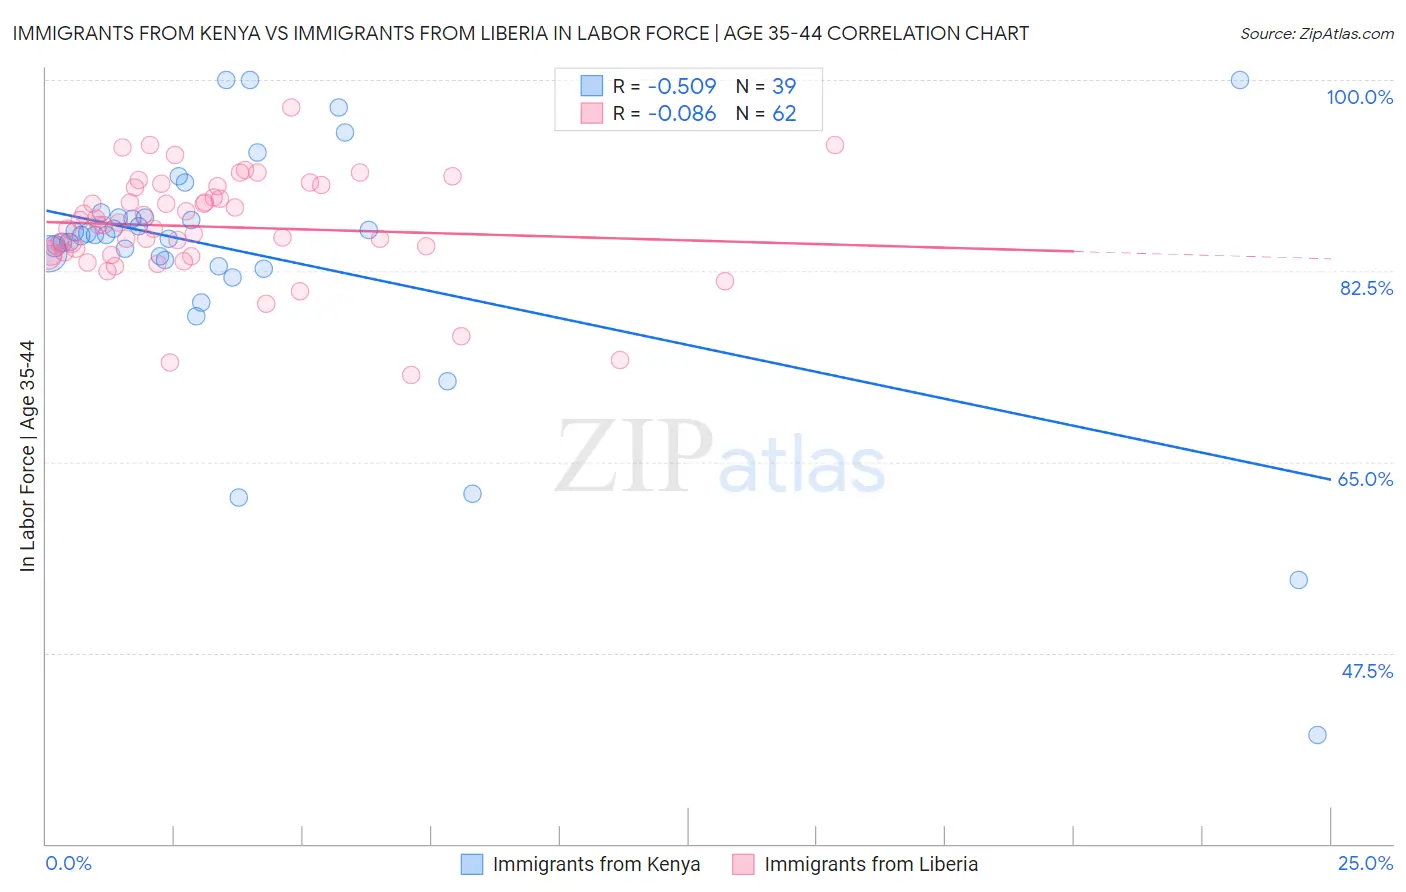
Immigrants from Kenya vs Immigrants from Liberia In Labor Force | Age 35-44 Correlation Chart
The statistical analysis conducted on geographies consisting of 218,019,455 people shows a substantial negative correlation between the proportion of Immigrants from Kenya and labor force participation rate among population between the ages 35 and 44 in the United States with a correlation coefficient (R) of -0.509 and weighted average of 85.1%. Similarly, the statistical analysis conducted on geographies consisting of 135,260,455 people shows a slight negative correlation between the proportion of Immigrants from Liberia and labor force participation rate among population between the ages 35 and 44 in the United States with a correlation coefficient (R) of -0.086 and weighted average of 85.4%, a difference of 0.28%.
In Labor Force | Age 35-44 Correlation Summary
| Measurement | Immigrants from Kenya | Immigrants from Liberia |
| Minimum | 40.0% | 73.0% |
| Maximum | 100.0% | 97.5% |
| Range | 60.0% | 24.5% |
| Mean | 83.7% | 86.5% |
| Median | 85.8% | 86.7% |
| Interquartile 25% (IQ1) | 82.9% | 84.0% |
| Interquartile 75% (IQ3) | 87.5% | 90.2% |
| Interquartile Range (IQR) | 4.6% | 6.2% |
| Standard Deviation (Sample) | 11.9% | 4.8% |
| Standard Deviation (Population) | 11.7% | 4.8% |
Similar Demographics by In Labor Force | Age 35-44
Demographics Similar to Immigrants from Kenya by In Labor Force | Age 35-44
In terms of in labor force | age 35-44, the demographic groups most similar to Immigrants from Kenya are Taiwanese (85.1%, a difference of 0.010%), Immigrants from Albania (85.1%, a difference of 0.030%), Turkish (85.1%, a difference of 0.030%), Soviet Union (85.1%, a difference of 0.030%), and Thai (85.2%, a difference of 0.040%).
| Demographics | Rating | Rank | In Labor Force | Age 35-44 |
| Cypriots | 99.8 /100 | #45 | Exceptional 85.2% |
| Immigrants | Hong Kong | 99.8 /100 | #46 | Exceptional 85.2% |
| German Russians | 99.8 /100 | #47 | Exceptional 85.2% |
| Immigrants | Eritrea | 99.7 /100 | #48 | Exceptional 85.2% |
| Croatians | 99.7 /100 | #49 | Exceptional 85.2% |
| Thais | 99.7 /100 | #50 | Exceptional 85.2% |
| Immigrants | Albania | 99.7 /100 | #51 | Exceptional 85.1% |
| Immigrants | Kenya | 99.6 /100 | #52 | Exceptional 85.1% |
| Taiwanese | 99.6 /100 | #53 | Exceptional 85.1% |
| Turks | 99.5 /100 | #54 | Exceptional 85.1% |
| Soviet Union | 99.5 /100 | #55 | Exceptional 85.1% |
| Immigrants | Croatia | 99.5 /100 | #56 | Exceptional 85.1% |
| Chinese | 99.4 /100 | #57 | Exceptional 85.1% |
| Slovaks | 99.4 /100 | #58 | Exceptional 85.1% |
| Serbians | 99.4 /100 | #59 | Exceptional 85.1% |
Demographics Similar to Immigrants from Liberia by In Labor Force | Age 35-44
In terms of in labor force | age 35-44, the demographic groups most similar to Immigrants from Liberia are Paraguayan (85.4%, a difference of 0.0%), Immigrants from Lithuania (85.4%, a difference of 0.0%), Latvian (85.4%, a difference of 0.010%), Immigrants from Greece (85.3%, a difference of 0.020%), and Cambodian (85.3%, a difference of 0.050%).
| Demographics | Rating | Rank | In Labor Force | Age 35-44 |
| Slovenes | 100.0 /100 | #19 | Exceptional 85.6% |
| Immigrants | Serbia | 100.0 /100 | #20 | Exceptional 85.5% |
| Bulgarians | 100.0 /100 | #21 | Exceptional 85.5% |
| Immigrants | Bosnia and Herzegovina | 100.0 /100 | #22 | Exceptional 85.4% |
| Immigrants | Eastern Africa | 100.0 /100 | #23 | Exceptional 85.4% |
| Latvians | 99.9 /100 | #24 | Exceptional 85.4% |
| Paraguayans | 99.9 /100 | #25 | Exceptional 85.4% |
| Immigrants | Liberia | 99.9 /100 | #26 | Exceptional 85.4% |
| Immigrants | Lithuania | 99.9 /100 | #27 | Exceptional 85.4% |
| Immigrants | Greece | 99.9 /100 | #28 | Exceptional 85.3% |
| Cambodians | 99.9 /100 | #29 | Exceptional 85.3% |
| Bermudans | 99.9 /100 | #30 | Exceptional 85.3% |
| Czechs | 99.9 /100 | #31 | Exceptional 85.3% |
| Immigrants | India | 99.9 /100 | #32 | Exceptional 85.3% |
| Ugandans | 99.9 /100 | #33 | Exceptional 85.3% |