Iranian vs Norwegian In Labor Force | Age 35-44
COMPARE
Iranian
Norwegian
In Labor Force | Age 35-44
In Labor Force | Age 35-44 Comparison
Iranians
Norwegians
84.5%
IN LABOR FORCE | AGE 35-44
69.4/ 100
METRIC RATING
154th/ 347
METRIC RANK
85.6%
IN LABOR FORCE | AGE 35-44
100.0/ 100
METRIC RATING
15th/ 347
METRIC RANK
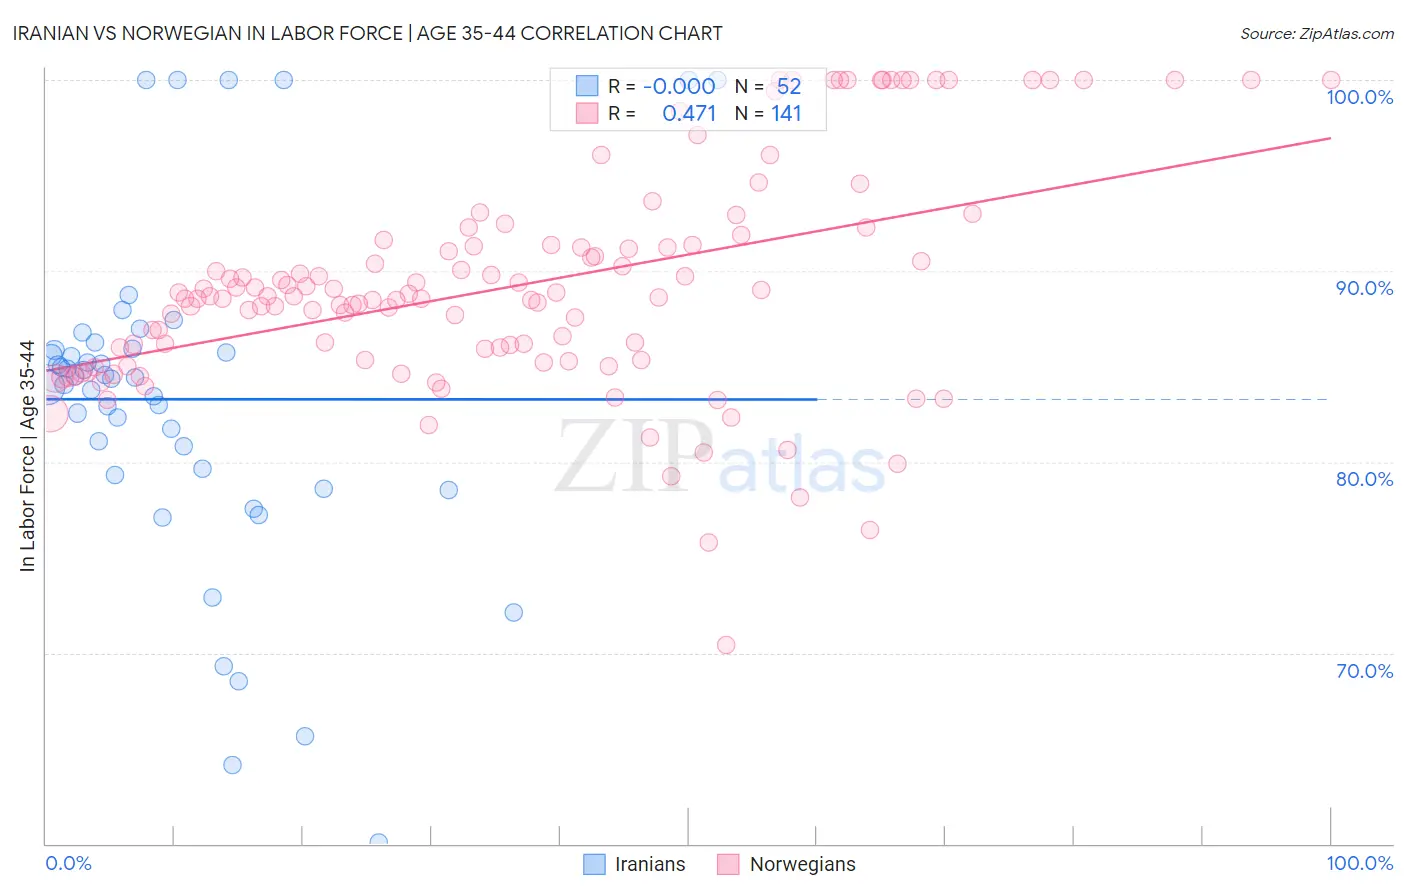
Iranian vs Norwegian In Labor Force | Age 35-44 Correlation Chart
The statistical analysis conducted on geographies consisting of 316,731,411 people shows no correlation between the proportion of Iranians and labor force participation rate among population between the ages 35 and 44 in the United States with a correlation coefficient (R) of -0.000 and weighted average of 84.5%. Similarly, the statistical analysis conducted on geographies consisting of 532,900,953 people shows a moderate positive correlation between the proportion of Norwegians and labor force participation rate among population between the ages 35 and 44 in the United States with a correlation coefficient (R) of 0.471 and weighted average of 85.6%, a difference of 1.3%.
In Labor Force | Age 35-44 Correlation Summary
| Measurement | Iranian | Norwegian |
| Minimum | 60.0% | 70.4% |
| Maximum | 100.0% | 100.0% |
| Range | 40.0% | 29.6% |
| Mean | 83.3% | 89.2% |
| Median | 84.4% | 88.6% |
| Interquartile 25% (IQ1) | 79.5% | 85.3% |
| Interquartile 75% (IQ3) | 85.9% | 91.3% |
| Interquartile Range (IQR) | 6.4% | 6.0% |
| Standard Deviation (Sample) | 8.7% | 5.8% |
| Standard Deviation (Population) | 8.7% | 5.8% |
Similar Demographics by In Labor Force | Age 35-44
Demographics Similar to Iranians by In Labor Force | Age 35-44
In terms of in labor force | age 35-44, the demographic groups most similar to Iranians are Trinidadian and Tobagonian (84.5%, a difference of 0.0%), Romanian (84.5%, a difference of 0.020%), Immigrants from Taiwan (84.5%, a difference of 0.020%), South American Indian (84.5%, a difference of 0.030%), and Okinawan (84.5%, a difference of 0.030%).
| Demographics | Rating | Rank | In Labor Force | Age 35-44 |
| Immigrants | Netherlands | 76.6 /100 | #147 | Good 84.5% |
| South American Indians | 73.6 /100 | #148 | Good 84.5% |
| Okinawans | 73.5 /100 | #149 | Good 84.5% |
| Immigrants | Nigeria | 73.3 /100 | #150 | Good 84.5% |
| Romanians | 72.1 /100 | #151 | Good 84.5% |
| Immigrants | Taiwan | 71.4 /100 | #152 | Good 84.5% |
| Trinidadians and Tobagonians | 69.5 /100 | #153 | Good 84.5% |
| Iranians | 69.4 /100 | #154 | Good 84.5% |
| Immigrants | Switzerland | 65.9 /100 | #155 | Good 84.5% |
| Immigrants | Israel | 64.3 /100 | #156 | Good 84.4% |
| Immigrants | Austria | 63.8 /100 | #157 | Good 84.4% |
| Jamaicans | 62.7 /100 | #158 | Good 84.4% |
| Immigrants | Senegal | 60.4 /100 | #159 | Good 84.4% |
| Immigrants | Kazakhstan | 60.4 /100 | #160 | Good 84.4% |
| Immigrants | Venezuela | 60.0 /100 | #161 | Good 84.4% |
Demographics Similar to Norwegians by In Labor Force | Age 35-44
In terms of in labor force | age 35-44, the demographic groups most similar to Norwegians are Immigrants from Ireland (85.6%, a difference of 0.0%), Somali (85.6%, a difference of 0.040%), Immigrants from Somalia (85.6%, a difference of 0.040%), Immigrants from North Macedonia (85.6%, a difference of 0.050%), and Carpatho Rusyn (85.6%, a difference of 0.050%).
| Demographics | Rating | Rank | In Labor Force | Age 35-44 |
| Immigrants | Ethiopia | 100.0 /100 | #8 | Exceptional 85.9% |
| Ethiopians | 100.0 /100 | #9 | Exceptional 85.9% |
| Cape Verdeans | 100.0 /100 | #10 | Exceptional 85.8% |
| Immigrants | Cameroon | 100.0 /100 | #11 | Exceptional 85.8% |
| Liberians | 100.0 /100 | #12 | Exceptional 85.7% |
| Somalis | 100.0 /100 | #13 | Exceptional 85.6% |
| Immigrants | Somalia | 100.0 /100 | #14 | Exceptional 85.6% |
| Norwegians | 100.0 /100 | #15 | Exceptional 85.6% |
| Immigrants | Ireland | 100.0 /100 | #16 | Exceptional 85.6% |
| Immigrants | North Macedonia | 100.0 /100 | #17 | Exceptional 85.6% |
| Carpatho Rusyns | 100.0 /100 | #18 | Exceptional 85.6% |
| Slovenes | 100.0 /100 | #19 | Exceptional 85.6% |
| Immigrants | Serbia | 100.0 /100 | #20 | Exceptional 85.5% |
| Bulgarians | 100.0 /100 | #21 | Exceptional 85.5% |
| Immigrants | Bosnia and Herzegovina | 100.0 /100 | #22 | Exceptional 85.4% |