Iranian vs Norwegian Master's Degree
COMPARE
Iranian
Norwegian
Master's Degree
Master's Degree Comparison
Iranians
Norwegians
22.3%
MASTER'S DEGREE
100.0/ 100
METRIC RATING
7th/ 347
METRIC RANK
14.0%
MASTER'S DEGREE
13.6/ 100
METRIC RATING
219th/ 347
METRIC RANK
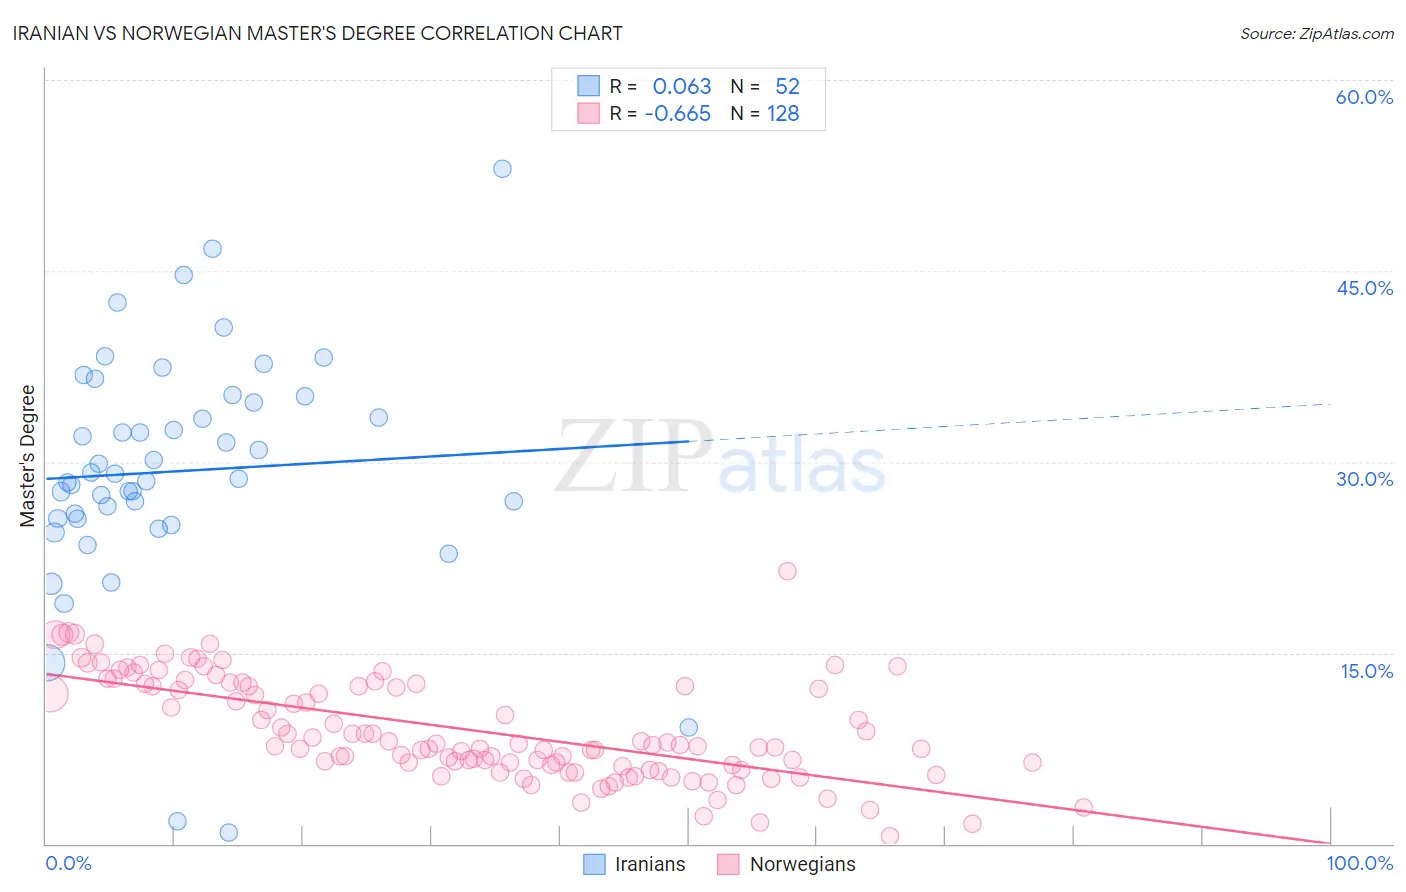
Iranian vs Norwegian Master's Degree Correlation Chart
The statistical analysis conducted on geographies consisting of 316,817,608 people shows a slight positive correlation between the proportion of Iranians and percentage of population with at least master's degree education in the United States with a correlation coefficient (R) of 0.063 and weighted average of 22.3%. Similarly, the statistical analysis conducted on geographies consisting of 532,895,610 people shows a significant negative correlation between the proportion of Norwegians and percentage of population with at least master's degree education in the United States with a correlation coefficient (R) of -0.665 and weighted average of 14.0%, a difference of 58.6%.
Master's Degree Correlation Summary
| Measurement | Iranian | Norwegian |
| Minimum | 0.89% | 0.57% |
| Maximum | 53.0% | 21.5% |
| Range | 52.1% | 20.9% |
| Mean | 29.3% | 9.0% |
| Median | 28.9% | 7.8% |
| Interquartile 25% (IQ1) | 25.5% | 6.2% |
| Interquartile 75% (IQ3) | 34.9% | 12.5% |
| Interquartile Range (IQR) | 9.4% | 6.3% |
| Standard Deviation (Sample) | 9.6% | 4.0% |
| Standard Deviation (Population) | 9.5% | 4.0% |
Similar Demographics by Master's Degree
Demographics Similar to Iranians by Master's Degree
In terms of master's degree, the demographic groups most similar to Iranians are Immigrants from India (22.3%, a difference of 0.21%), Immigrants from Taiwan (22.5%, a difference of 0.88%), Immigrants from Israel (22.6%, a difference of 1.7%), Okinawan (22.6%, a difference of 1.7%), and Cypriot (21.8%, a difference of 2.2%).
| Demographics | Rating | Rank | Master's Degree |
| Immigrants | Singapore | 100.0 /100 | #1 | Exceptional 23.4% |
| Filipinos | 100.0 /100 | #2 | Exceptional 23.4% |
| Immigrants | Israel | 100.0 /100 | #3 | Exceptional 22.6% |
| Okinawans | 100.0 /100 | #4 | Exceptional 22.6% |
| Immigrants | Taiwan | 100.0 /100 | #5 | Exceptional 22.5% |
| Immigrants | India | 100.0 /100 | #6 | Exceptional 22.3% |
| Iranians | 100.0 /100 | #7 | Exceptional 22.3% |
| Cypriots | 100.0 /100 | #8 | Exceptional 21.8% |
| Thais | 100.0 /100 | #9 | Exceptional 21.7% |
| Immigrants | Iran | 100.0 /100 | #10 | Exceptional 21.6% |
| Immigrants | China | 100.0 /100 | #11 | Exceptional 21.2% |
| Eastern Europeans | 100.0 /100 | #12 | Exceptional 21.1% |
| Immigrants | Australia | 100.0 /100 | #13 | Exceptional 20.9% |
| Immigrants | Switzerland | 100.0 /100 | #14 | Exceptional 20.9% |
| Immigrants | Eastern Asia | 100.0 /100 | #15 | Exceptional 20.8% |
Demographics Similar to Norwegians by Master's Degree
In terms of master's degree, the demographic groups most similar to Norwegians are German (14.0%, a difference of 0.15%), Korean (14.0%, a difference of 0.29%), Ecuadorian (14.0%, a difference of 0.32%), French Canadian (14.1%, a difference of 0.35%), and Immigrants from South Eastern Asia (14.0%, a difference of 0.52%).
| Demographics | Rating | Rank | Master's Degree |
| Spanish | 17.8 /100 | #212 | Poor 14.2% |
| Immigrants | Thailand | 17.0 /100 | #213 | Poor 14.2% |
| Finns | 16.9 /100 | #214 | Poor 14.2% |
| Immigrants | Vietnam | 16.1 /100 | #215 | Poor 14.1% |
| Immigrants | Somalia | 15.8 /100 | #216 | Poor 14.1% |
| Immigrants | Trinidad and Tobago | 15.8 /100 | #217 | Poor 14.1% |
| French Canadians | 14.9 /100 | #218 | Poor 14.1% |
| Norwegians | 13.6 /100 | #219 | Poor 14.0% |
| Germans | 13.1 /100 | #220 | Poor 14.0% |
| Koreans | 12.7 /100 | #221 | Poor 14.0% |
| Ecuadorians | 12.6 /100 | #222 | Poor 14.0% |
| Immigrants | South Eastern Asia | 11.9 /100 | #223 | Poor 14.0% |
| Immigrants | Grenada | 11.8 /100 | #224 | Poor 14.0% |
| Portuguese | 11.2 /100 | #225 | Poor 13.9% |
| Immigrants | St. Vincent and the Grenadines | 11.0 /100 | #226 | Poor 13.9% |