Iranian vs Immigrants from Iran In Labor Force | Age 35-44
COMPARE
Iranian
Immigrants from Iran
In Labor Force | Age 35-44
In Labor Force | Age 35-44 Comparison
Iranians
Immigrants from Iran
84.5%
IN LABOR FORCE | AGE 35-44
69.4/ 100
METRIC RATING
154th/ 347
METRIC RANK
84.4%
IN LABOR FORCE | AGE 35-44
50.0/ 100
METRIC RATING
174th/ 347
METRIC RANK
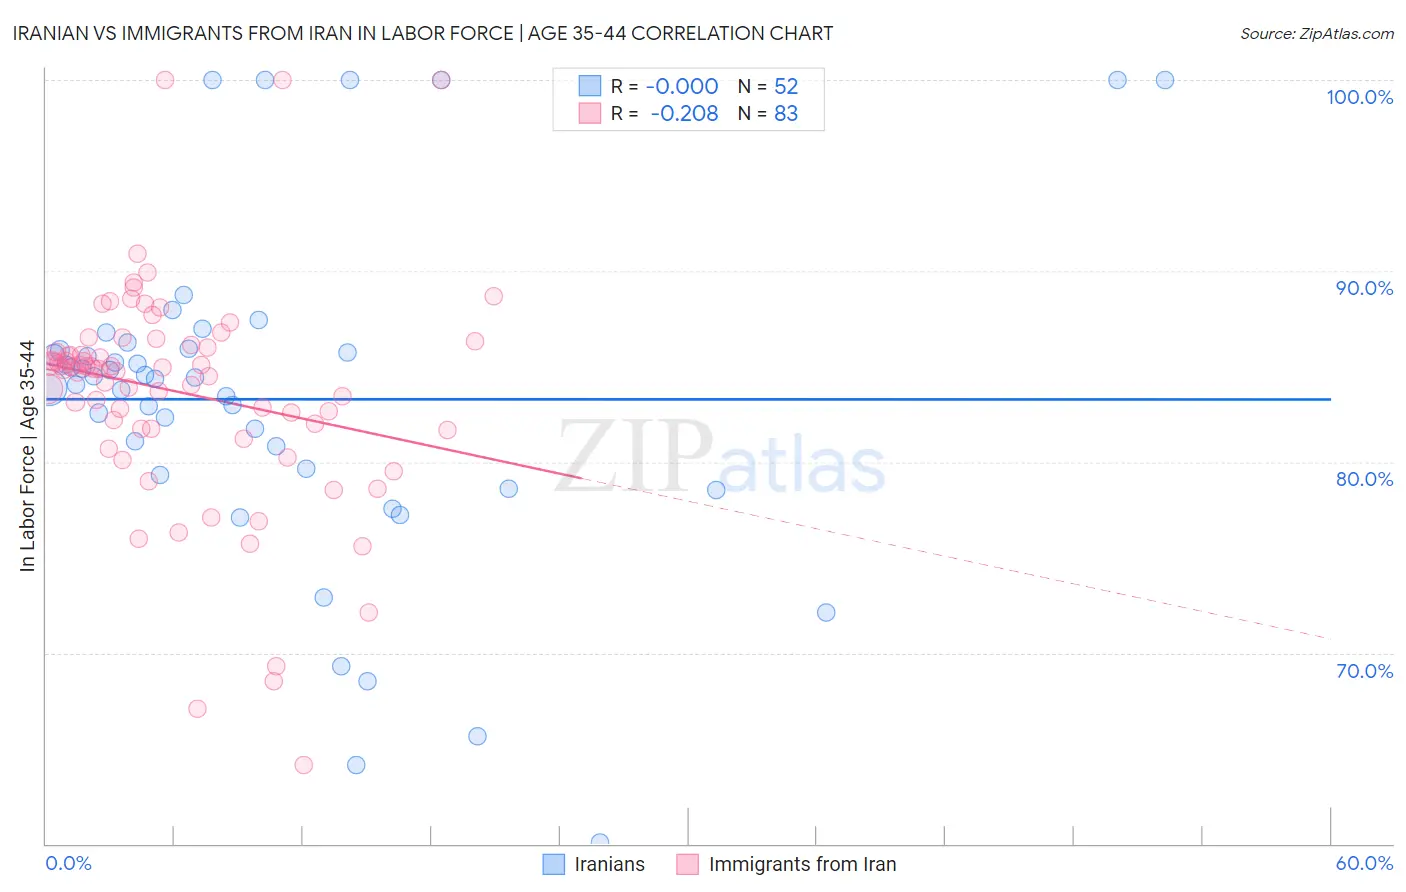
Iranian vs Immigrants from Iran In Labor Force | Age 35-44 Correlation Chart
The statistical analysis conducted on geographies consisting of 316,731,411 people shows no correlation between the proportion of Iranians and labor force participation rate among population between the ages 35 and 44 in the United States with a correlation coefficient (R) of -0.000 and weighted average of 84.5%. Similarly, the statistical analysis conducted on geographies consisting of 279,863,653 people shows a weak negative correlation between the proportion of Immigrants from Iran and labor force participation rate among population between the ages 35 and 44 in the United States with a correlation coefficient (R) of -0.208 and weighted average of 84.4%, a difference of 0.13%.
In Labor Force | Age 35-44 Correlation Summary
| Measurement | Iranian | Immigrants from Iran |
| Minimum | 60.0% | 64.1% |
| Maximum | 100.0% | 100.0% |
| Range | 40.0% | 35.9% |
| Mean | 83.3% | 83.7% |
| Median | 84.4% | 84.9% |
| Interquartile 25% (IQ1) | 79.5% | 81.7% |
| Interquartile 75% (IQ3) | 85.9% | 86.1% |
| Interquartile Range (IQR) | 6.4% | 4.4% |
| Standard Deviation (Sample) | 8.7% | 6.0% |
| Standard Deviation (Population) | 8.7% | 5.9% |
Demographics Similar to Iranians and Immigrants from Iran by In Labor Force | Age 35-44
In terms of in labor force | age 35-44, the demographic groups most similar to Iranians are Immigrants from Switzerland (84.5%, a difference of 0.030%), Immigrants from Israel (84.4%, a difference of 0.040%), Immigrants from Austria (84.4%, a difference of 0.040%), Jamaican (84.4%, a difference of 0.050%), and Immigrants from Senegal (84.4%, a difference of 0.060%). Similarly, the demographic groups most similar to Immigrants from Iran are Immigrants from Trinidad and Tobago (84.4%, a difference of 0.0%), Jordanian (84.4%, a difference of 0.010%), Scandinavian (84.4%, a difference of 0.010%), Irish (84.4%, a difference of 0.020%), and Immigrants from Afghanistan (84.4%, a difference of 0.020%).
| Demographics | Rating | Rank | In Labor Force | Age 35-44 |
| Iranians | 69.4 /100 | #154 | Good 84.5% |
| Immigrants | Switzerland | 65.9 /100 | #155 | Good 84.5% |
| Immigrants | Israel | 64.3 /100 | #156 | Good 84.4% |
| Immigrants | Austria | 63.8 /100 | #157 | Good 84.4% |
| Jamaicans | 62.7 /100 | #158 | Good 84.4% |
| Immigrants | Senegal | 60.4 /100 | #159 | Good 84.4% |
| Immigrants | Kazakhstan | 60.4 /100 | #160 | Good 84.4% |
| Immigrants | Venezuela | 60.0 /100 | #161 | Good 84.4% |
| Immigrants | Hungary | 59.4 /100 | #162 | Average 84.4% |
| Aleuts | 59.1 /100 | #163 | Average 84.4% |
| Nigerians | 58.9 /100 | #164 | Average 84.4% |
| Venezuelans | 58.1 /100 | #165 | Average 84.4% |
| Alsatians | 55.2 /100 | #166 | Average 84.4% |
| Immigrants | Portugal | 55.2 /100 | #167 | Average 84.4% |
| Irish | 53.1 /100 | #168 | Average 84.4% |
| Immigrants | Afghanistan | 52.7 /100 | #169 | Average 84.4% |
| Immigrants | Jordan | 52.5 /100 | #170 | Average 84.4% |
| Jordanians | 51.7 /100 | #171 | Average 84.4% |
| Scandinavians | 51.2 /100 | #172 | Average 84.4% |
| Immigrants | Trinidad and Tobago | 50.7 /100 | #173 | Average 84.4% |
| Immigrants | Iran | 50.0 /100 | #174 | Average 84.4% |