Swiss vs Mexican American Indian In Labor Force | Age 30-34
COMPARE
Swiss
Mexican American Indian
In Labor Force | Age 30-34
In Labor Force | Age 30-34 Comparison
Swiss
Mexican American Indians
84.3%
IN LABOR FORCE | AGE 30-34
5.8/ 100
METRIC RATING
219th/ 347
METRIC RANK
83.2%
IN LABOR FORCE | AGE 30-34
0.0/ 100
METRIC RATING
282nd/ 347
METRIC RANK
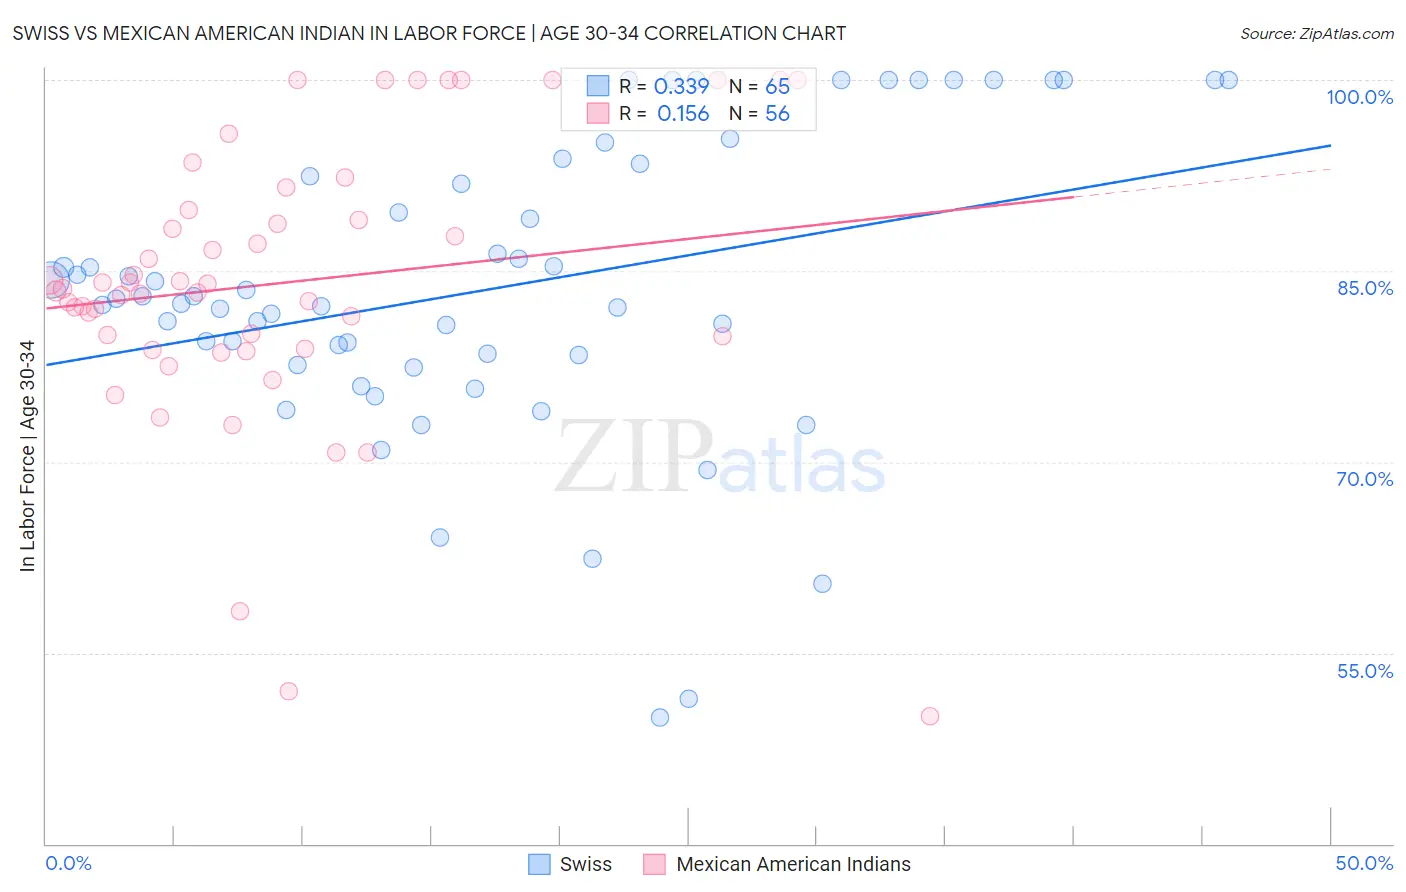
Swiss vs Mexican American Indian In Labor Force | Age 30-34 Correlation Chart
The statistical analysis conducted on geographies consisting of 464,594,297 people shows a mild positive correlation between the proportion of Swiss and labor force participation rate among population between the ages 30 and 34 in the United States with a correlation coefficient (R) of 0.339 and weighted average of 84.3%. Similarly, the statistical analysis conducted on geographies consisting of 317,534,502 people shows a poor positive correlation between the proportion of Mexican American Indians and labor force participation rate among population between the ages 30 and 34 in the United States with a correlation coefficient (R) of 0.156 and weighted average of 83.2%, a difference of 1.3%.
In Labor Force | Age 30-34 Correlation Summary
| Measurement | Swiss | Mexican American Indian |
| Minimum | 49.9% | 50.0% |
| Maximum | 100.0% | 100.0% |
| Range | 50.1% | 50.0% |
| Mean | 83.6% | 84.0% |
| Median | 82.8% | 83.5% |
| Interquartile 25% (IQ1) | 78.0% | 79.4% |
| Interquartile 75% (IQ3) | 93.0% | 89.4% |
| Interquartile Range (IQR) | 15.0% | 10.0% |
| Standard Deviation (Sample) | 11.7% | 10.9% |
| Standard Deviation (Population) | 11.6% | 10.8% |
Similar Demographics by In Labor Force | Age 30-34
Demographics Similar to Swiss by In Labor Force | Age 30-34
In terms of in labor force | age 30-34, the demographic groups most similar to Swiss are Immigrants from Panama (84.3%, a difference of 0.020%), Danish (84.3%, a difference of 0.020%), Immigrants from Germany (84.3%, a difference of 0.040%), European (84.3%, a difference of 0.040%), and Immigrants from Ecuador (84.3%, a difference of 0.040%).
| Demographics | Rating | Rank | In Labor Force | Age 30-34 |
| Immigrants | Western Asia | 8.2 /100 | #212 | Tragic 84.3% |
| Immigrants | Jamaica | 7.9 /100 | #213 | Tragic 84.3% |
| Immigrants | Germany | 7.2 /100 | #214 | Tragic 84.3% |
| Europeans | 7.2 /100 | #215 | Tragic 84.3% |
| Immigrants | Ecuador | 7.1 /100 | #216 | Tragic 84.3% |
| Immigrants | Trinidad and Tobago | 7.0 /100 | #217 | Tragic 84.3% |
| Immigrants | Panama | 6.3 /100 | #218 | Tragic 84.3% |
| Swiss | 5.8 /100 | #219 | Tragic 84.3% |
| Danes | 5.3 /100 | #220 | Tragic 84.3% |
| Salvadorans | 3.8 /100 | #221 | Tragic 84.2% |
| Panamanians | 3.8 /100 | #222 | Tragic 84.2% |
| Immigrants | Laos | 3.6 /100 | #223 | Tragic 84.2% |
| Cubans | 3.4 /100 | #224 | Tragic 84.2% |
| Scottish | 3.1 /100 | #225 | Tragic 84.2% |
| Immigrants | El Salvador | 3.0 /100 | #226 | Tragic 84.2% |
Demographics Similar to Mexican American Indians by In Labor Force | Age 30-34
In terms of in labor force | age 30-34, the demographic groups most similar to Mexican American Indians are Assyrian/Chaldean/Syriac (83.2%, a difference of 0.010%), Samoan (83.3%, a difference of 0.040%), Immigrants from Belize (83.2%, a difference of 0.070%), Cree (83.2%, a difference of 0.070%), and Immigrants from Latin America (83.1%, a difference of 0.12%).
| Demographics | Rating | Rank | In Labor Force | Age 30-34 |
| Immigrants | Grenada | 0.0 /100 | #275 | Tragic 83.5% |
| Tongans | 0.0 /100 | #276 | Tragic 83.5% |
| Delaware | 0.0 /100 | #277 | Tragic 83.5% |
| Fijians | 0.0 /100 | #278 | Tragic 83.4% |
| Immigrants | Fiji | 0.0 /100 | #279 | Tragic 83.4% |
| Africans | 0.0 /100 | #280 | Tragic 83.4% |
| Samoans | 0.0 /100 | #281 | Tragic 83.3% |
| Mexican American Indians | 0.0 /100 | #282 | Tragic 83.2% |
| Assyrians/Chaldeans/Syriacs | 0.0 /100 | #283 | Tragic 83.2% |
| Immigrants | Belize | 0.0 /100 | #284 | Tragic 83.2% |
| Cree | 0.0 /100 | #285 | Tragic 83.2% |
| Immigrants | Latin America | 0.0 /100 | #286 | Tragic 83.1% |
| Native Hawaiians | 0.0 /100 | #287 | Tragic 83.0% |
| Central American Indians | 0.0 /100 | #288 | Tragic 83.0% |
| Hawaiians | 0.0 /100 | #289 | Tragic 83.0% |