Syrian vs Immigrants from El Salvador In Labor Force | Age 45-54
COMPARE
Syrian
Immigrants from El Salvador
In Labor Force | Age 45-54
In Labor Force | Age 45-54 Comparison
Syrians
Immigrants from El Salvador
82.6%
IN LABOR FORCE | AGE 45-54
26.0/ 100
METRIC RATING
189th/ 347
METRIC RANK
81.9%
IN LABOR FORCE | AGE 45-54
1.0/ 100
METRIC RATING
240th/ 347
METRIC RANK
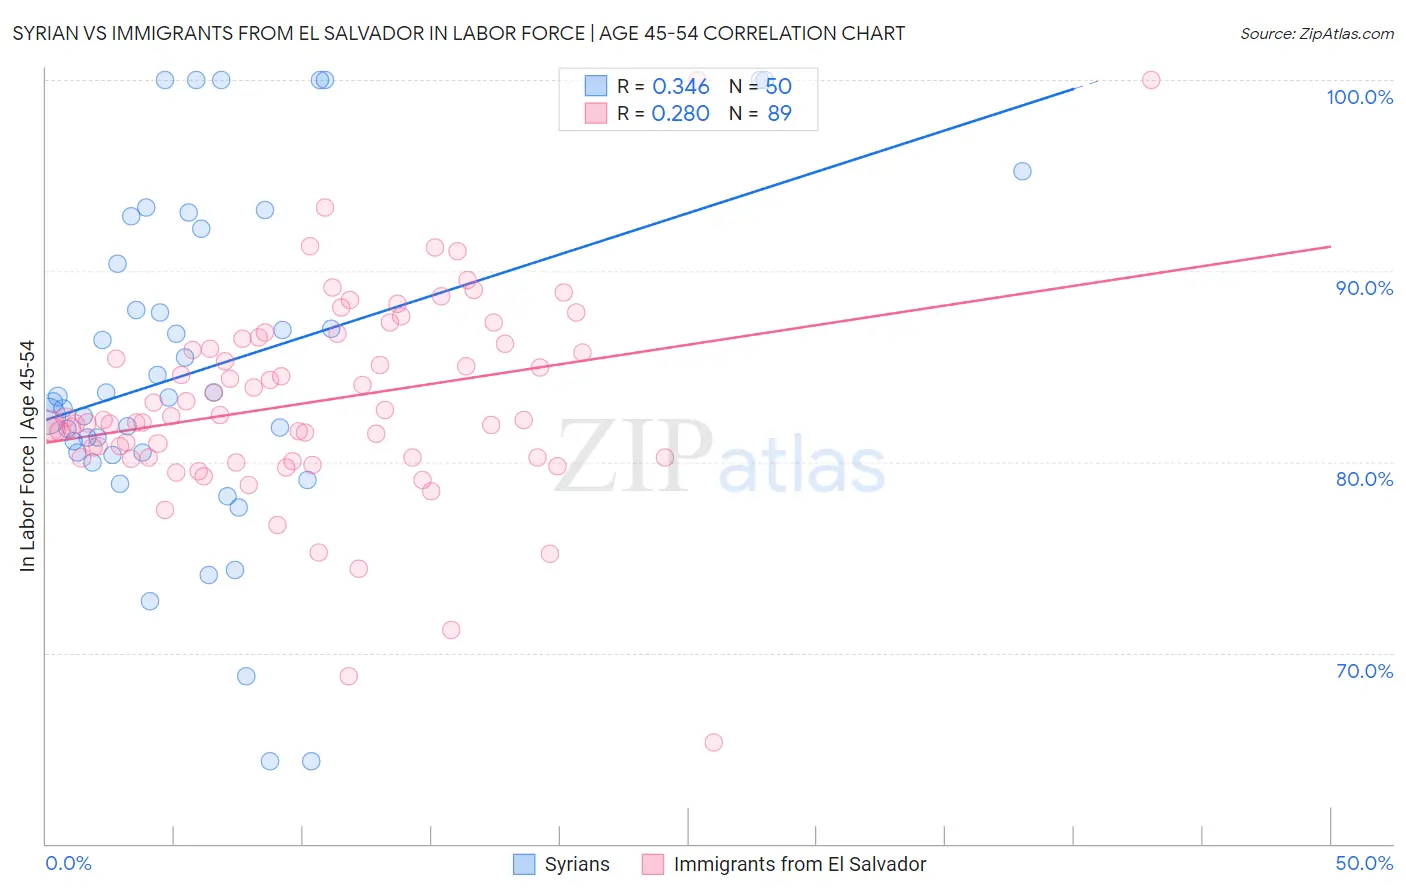
Syrian vs Immigrants from El Salvador In Labor Force | Age 45-54 Correlation Chart
The statistical analysis conducted on geographies consisting of 266,195,129 people shows a mild positive correlation between the proportion of Syrians and labor force participation rate among population between the ages 45 and 54 in the United States with a correlation coefficient (R) of 0.346 and weighted average of 82.6%. Similarly, the statistical analysis conducted on geographies consisting of 357,696,462 people shows a weak positive correlation between the proportion of Immigrants from El Salvador and labor force participation rate among population between the ages 45 and 54 in the United States with a correlation coefficient (R) of 0.280 and weighted average of 81.9%, a difference of 0.79%.
In Labor Force | Age 45-54 Correlation Summary
| Measurement | Syrian | Immigrants from El Salvador |
| Minimum | 64.3% | 65.3% |
| Maximum | 100.0% | 100.0% |
| Range | 35.7% | 34.7% |
| Mean | 85.0% | 83.1% |
| Median | 83.4% | 82.2% |
| Interquartile 25% (IQ1) | 80.5% | 80.2% |
| Interquartile 75% (IQ3) | 92.2% | 86.3% |
| Interquartile Range (IQR) | 11.7% | 6.1% |
| Standard Deviation (Sample) | 8.9% | 5.3% |
| Standard Deviation (Population) | 8.9% | 5.3% |
Similar Demographics by In Labor Force | Age 45-54
Demographics Similar to Syrians by In Labor Force | Age 45-54
In terms of in labor force | age 45-54, the demographic groups most similar to Syrians are British (82.6%, a difference of 0.0%), South African (82.6%, a difference of 0.020%), Irish (82.6%, a difference of 0.030%), Immigrants from Costa Rica (82.6%, a difference of 0.030%), and Armenian (82.5%, a difference of 0.030%).
| Demographics | Rating | Rank | In Labor Force | Age 45-54 |
| Immigrants | Hungary | 37.1 /100 | #182 | Fair 82.7% |
| New Zealanders | 32.7 /100 | #183 | Fair 82.6% |
| Europeans | 32.6 /100 | #184 | Fair 82.6% |
| Immigrants | England | 32.2 /100 | #185 | Fair 82.6% |
| Irish | 29.2 /100 | #186 | Fair 82.6% |
| Immigrants | Costa Rica | 28.3 /100 | #187 | Fair 82.6% |
| South Africans | 28.0 /100 | #188 | Fair 82.6% |
| Syrians | 26.0 /100 | #189 | Fair 82.6% |
| British | 25.7 /100 | #190 | Fair 82.6% |
| Armenians | 23.2 /100 | #191 | Fair 82.5% |
| Immigrants | Iraq | 20.9 /100 | #192 | Fair 82.5% |
| Australians | 20.8 /100 | #193 | Fair 82.5% |
| Immigrants | Norway | 20.7 /100 | #194 | Fair 82.5% |
| Immigrants | Canada | 20.0 /100 | #195 | Fair 82.5% |
| Immigrants | North America | 18.8 /100 | #196 | Poor 82.5% |
Demographics Similar to Immigrants from El Salvador by In Labor Force | Age 45-54
In terms of in labor force | age 45-54, the demographic groups most similar to Immigrants from El Salvador are Immigrants from Thailand (81.9%, a difference of 0.010%), Trinidadian and Tobagonian (81.9%, a difference of 0.030%), Immigrants from Trinidad and Tobago (82.0%, a difference of 0.040%), Subsaharan African (82.0%, a difference of 0.050%), and Basque (82.0%, a difference of 0.050%).
| Demographics | Rating | Rank | In Labor Force | Age 45-54 |
| Malaysians | 1.7 /100 | #233 | Tragic 82.0% |
| Salvadorans | 1.7 /100 | #234 | Tragic 82.0% |
| Sub-Saharan Africans | 1.2 /100 | #235 | Tragic 82.0% |
| Basques | 1.2 /100 | #236 | Tragic 82.0% |
| Immigrants | Trinidad and Tobago | 1.2 /100 | #237 | Tragic 82.0% |
| Trinidadians and Tobagonians | 1.1 /100 | #238 | Tragic 81.9% |
| Immigrants | Thailand | 1.0 /100 | #239 | Tragic 81.9% |
| Immigrants | El Salvador | 1.0 /100 | #240 | Tragic 81.9% |
| Immigrants | Cambodia | 0.8 /100 | #241 | Tragic 81.9% |
| Whites/Caucasians | 0.7 /100 | #242 | Tragic 81.9% |
| Samoans | 0.6 /100 | #243 | Tragic 81.8% |
| Celtics | 0.4 /100 | #244 | Tragic 81.8% |
| Alaska Natives | 0.4 /100 | #245 | Tragic 81.8% |
| Alaskan Athabascans | 0.4 /100 | #246 | Tragic 81.8% |
| Central Americans | 0.4 /100 | #247 | Tragic 81.7% |