South American vs Costa Rican In Labor Force | Age 25-29
COMPARE
South American
Costa Rican
In Labor Force | Age 25-29
In Labor Force | Age 25-29 Comparison
South Americans
Costa Ricans
84.7%
IN LABOR FORCE | AGE 25-29
54.9/ 100
METRIC RATING
168th/ 347
METRIC RANK
85.0%
IN LABOR FORCE | AGE 25-29
91.9/ 100
METRIC RATING
109th/ 347
METRIC RANK
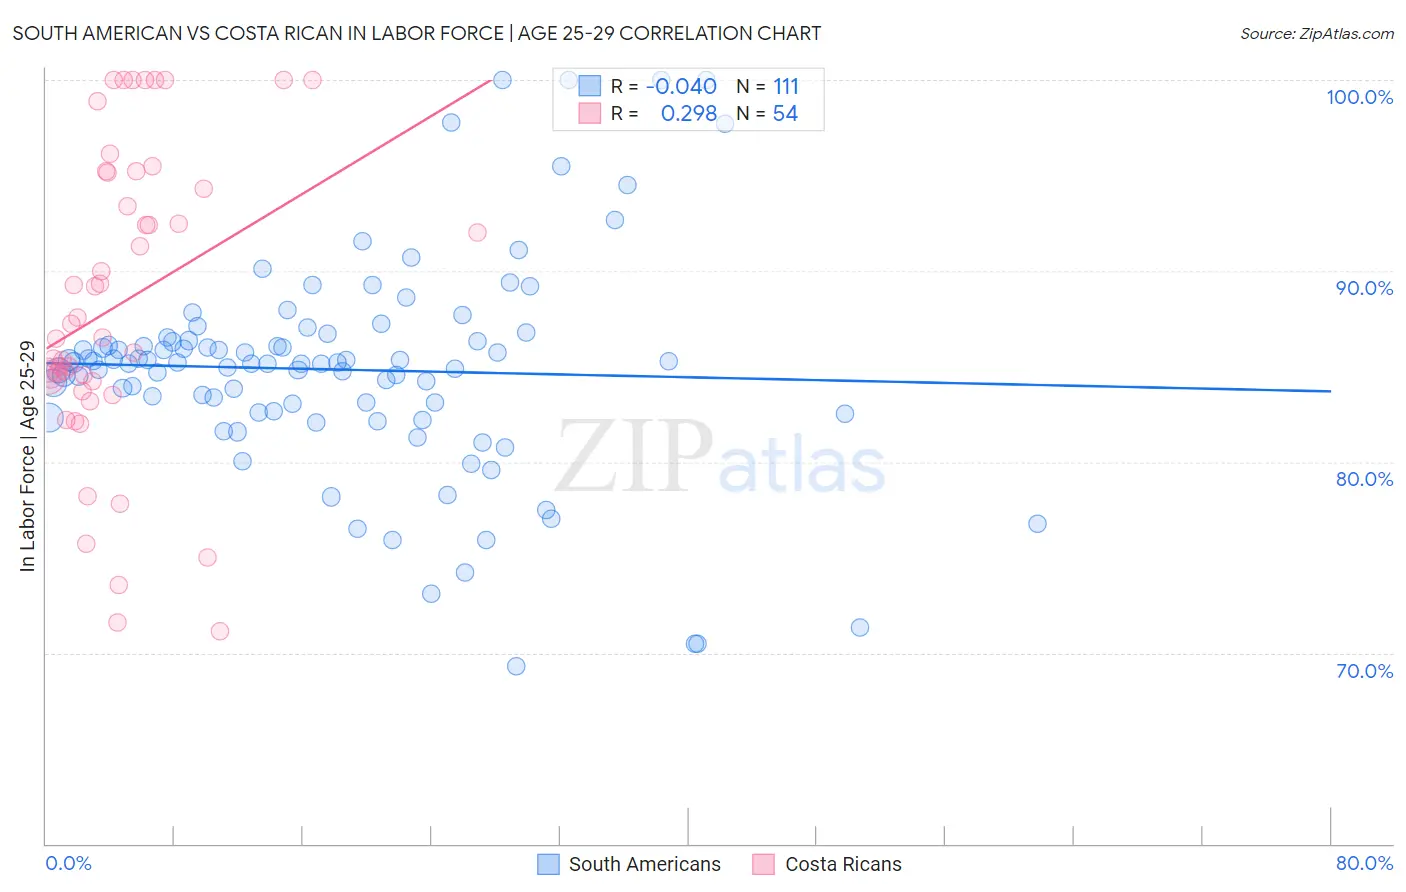
South American vs Costa Rican In Labor Force | Age 25-29 Correlation Chart
The statistical analysis conducted on geographies consisting of 493,840,082 people shows no correlation between the proportion of South Americans and labor force participation rate among population between the ages 25 and 29 in the United States with a correlation coefficient (R) of -0.040 and weighted average of 84.7%. Similarly, the statistical analysis conducted on geographies consisting of 253,578,861 people shows a weak positive correlation between the proportion of Costa Ricans and labor force participation rate among population between the ages 25 and 29 in the United States with a correlation coefficient (R) of 0.298 and weighted average of 85.0%, a difference of 0.41%.
In Labor Force | Age 25-29 Correlation Summary
| Measurement | South American | Costa Rican |
| Minimum | 69.3% | 71.1% |
| Maximum | 100.0% | 100.0% |
| Range | 30.7% | 28.9% |
| Mean | 84.8% | 88.3% |
| Median | 85.2% | 86.9% |
| Interquartile 25% (IQ1) | 82.6% | 84.2% |
| Interquartile 75% (IQ3) | 86.4% | 95.2% |
| Interquartile Range (IQR) | 3.7% | 11.0% |
| Standard Deviation (Sample) | 5.7% | 7.9% |
| Standard Deviation (Population) | 5.7% | 7.8% |
Similar Demographics by In Labor Force | Age 25-29
Demographics Similar to South Americans by In Labor Force | Age 25-29
In terms of in labor force | age 25-29, the demographic groups most similar to South Americans are Immigrants from Spain (84.7%, a difference of 0.010%), Indonesian (84.7%, a difference of 0.010%), Argentinean (84.7%, a difference of 0.020%), Ghanaian (84.7%, a difference of 0.020%), and Immigrants from Burma/Myanmar (84.7%, a difference of 0.020%).
| Demographics | Rating | Rank | In Labor Force | Age 25-29 |
| Canadians | 58.5 /100 | #161 | Average 84.7% |
| Immigrants | Colombia | 58.3 /100 | #162 | Average 84.7% |
| Argentineans | 57.9 /100 | #163 | Average 84.7% |
| Ghanaians | 57.6 /100 | #164 | Average 84.7% |
| Immigrants | Burma/Myanmar | 57.4 /100 | #165 | Average 84.7% |
| Immigrants | Spain | 56.9 /100 | #166 | Average 84.7% |
| Indonesians | 56.5 /100 | #167 | Average 84.7% |
| South Americans | 54.9 /100 | #168 | Average 84.7% |
| Celtics | 52.5 /100 | #169 | Average 84.7% |
| Tongans | 52.4 /100 | #170 | Average 84.7% |
| Immigrants | Vietnam | 50.5 /100 | #171 | Average 84.7% |
| Immigrants | Western Europe | 50.4 /100 | #172 | Average 84.7% |
| Assyrians/Chaldeans/Syriacs | 50.2 /100 | #173 | Average 84.7% |
| Palestinians | 50.0 /100 | #174 | Average 84.7% |
| Hungarians | 47.8 /100 | #175 | Average 84.6% |
Demographics Similar to Costa Ricans by In Labor Force | Age 25-29
In terms of in labor force | age 25-29, the demographic groups most similar to Costa Ricans are Immigrants from Austria (85.0%, a difference of 0.0%), Immigrants from Southern Europe (85.0%, a difference of 0.010%), New Zealander (85.0%, a difference of 0.010%), Immigrants from Middle Africa (85.0%, a difference of 0.010%), and Immigrants from Hong Kong (85.0%, a difference of 0.020%).
| Demographics | Rating | Rank | In Labor Force | Age 25-29 |
| Slavs | 93.7 /100 | #102 | Exceptional 85.1% |
| Immigrants | Japan | 93.5 /100 | #103 | Exceptional 85.1% |
| Immigrants | Zaire | 93.3 /100 | #104 | Exceptional 85.1% |
| Immigrants | Hong Kong | 92.8 /100 | #105 | Exceptional 85.0% |
| Czechoslovakians | 92.6 /100 | #106 | Exceptional 85.0% |
| Immigrants | Southern Europe | 92.3 /100 | #107 | Exceptional 85.0% |
| Immigrants | Austria | 91.9 /100 | #108 | Exceptional 85.0% |
| Costa Ricans | 91.9 /100 | #109 | Exceptional 85.0% |
| New Zealanders | 91.5 /100 | #110 | Exceptional 85.0% |
| Immigrants | Middle Africa | 91.4 /100 | #111 | Exceptional 85.0% |
| Senegalese | 90.9 /100 | #112 | Exceptional 85.0% |
| Irish | 90.6 /100 | #113 | Exceptional 85.0% |
| Immigrants | Malaysia | 90.4 /100 | #114 | Exceptional 85.0% |
| South Africans | 88.9 /100 | #115 | Excellent 85.0% |
| Chileans | 88.8 /100 | #116 | Excellent 85.0% |