Indonesian vs Tohono O'odham In Labor Force | Age 30-34
COMPARE
Indonesian
Tohono O'odham
In Labor Force | Age 30-34
In Labor Force | Age 30-34 Comparison
Indonesians
Tohono O'odham
84.3%
IN LABOR FORCE | AGE 30-34
8.8/ 100
METRIC RATING
210th/ 347
METRIC RANK
77.7%
IN LABOR FORCE | AGE 30-34
0.0/ 100
METRIC RATING
342nd/ 347
METRIC RANK
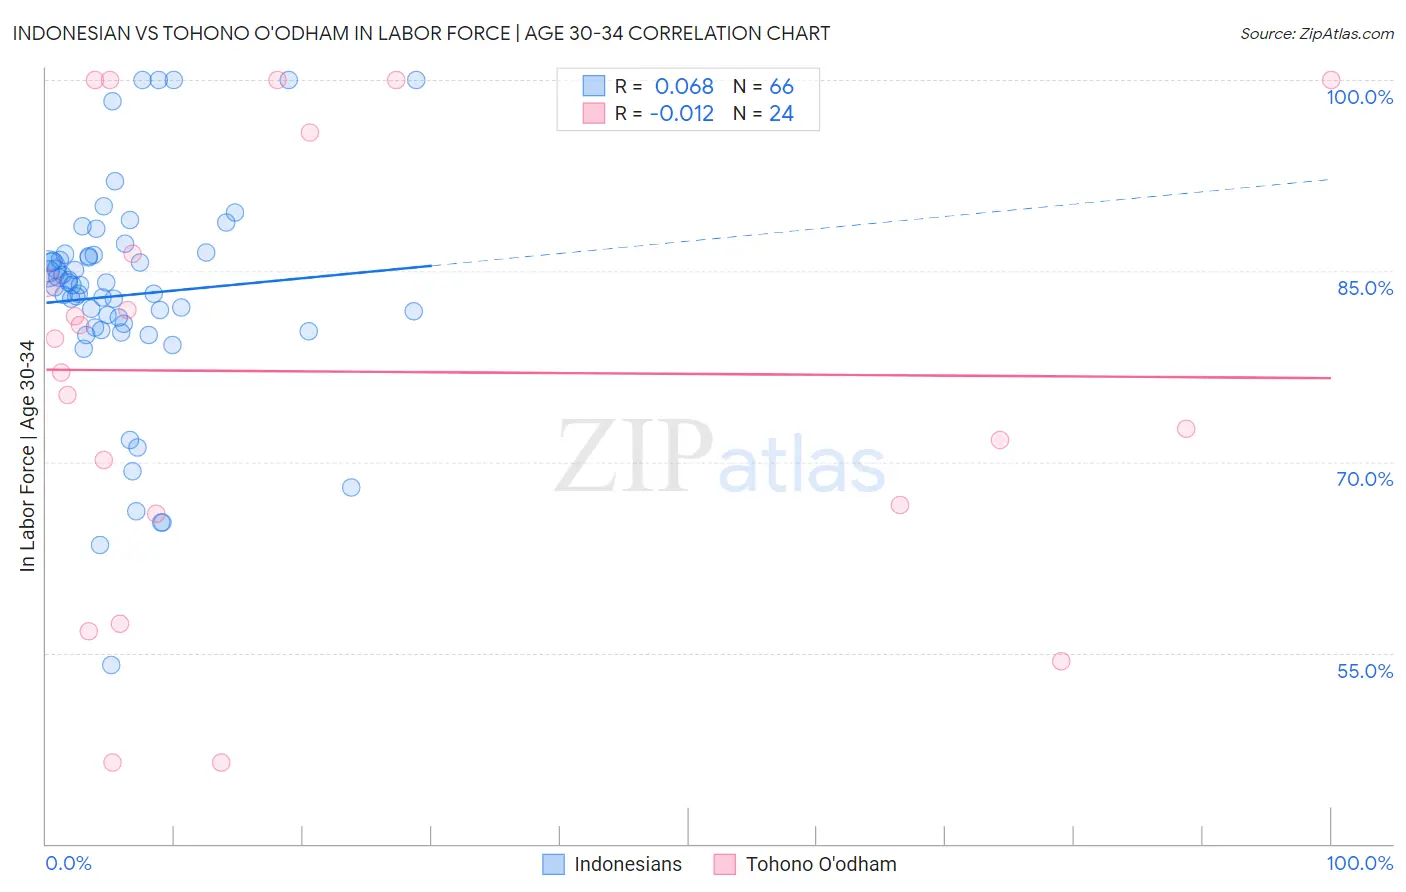
Indonesian vs Tohono O'odham In Labor Force | Age 30-34 Correlation Chart
The statistical analysis conducted on geographies consisting of 162,689,196 people shows a slight positive correlation between the proportion of Indonesians and labor force participation rate among population between the ages 30 and 34 in the United States with a correlation coefficient (R) of 0.068 and weighted average of 84.3%. Similarly, the statistical analysis conducted on geographies consisting of 58,711,323 people shows no correlation between the proportion of Tohono O'odham and labor force participation rate among population between the ages 30 and 34 in the United States with a correlation coefficient (R) of -0.012 and weighted average of 77.7%, a difference of 8.5%.
In Labor Force | Age 30-34 Correlation Summary
| Measurement | Indonesian | Tohono O'odham |
| Minimum | 54.0% | 46.4% |
| Maximum | 100.0% | 100.0% |
| Range | 46.0% | 53.6% |
| Mean | 83.1% | 77.1% |
| Median | 83.9% | 78.3% |
| Interquartile 25% (IQ1) | 80.6% | 66.3% |
| Interquartile 75% (IQ3) | 86.2% | 91.1% |
| Interquartile Range (IQR) | 5.6% | 24.8% |
| Standard Deviation (Sample) | 8.8% | 17.1% |
| Standard Deviation (Population) | 8.7% | 16.7% |
Similar Demographics by In Labor Force | Age 30-34
Demographics Similar to Indonesians by In Labor Force | Age 30-34
In terms of in labor force | age 30-34, the demographic groups most similar to Indonesians are Arab (84.3%, a difference of 0.0%), Jamaican (84.3%, a difference of 0.0%), Japanese (84.3%, a difference of 0.0%), Bangladeshi (84.3%, a difference of 0.010%), and Immigrants from Western Asia (84.3%, a difference of 0.010%).
| Demographics | Rating | Rank | In Labor Force | Age 30-34 |
| Canadians | 15.4 /100 | #203 | Poor 84.4% |
| Ecuadorians | 14.2 /100 | #204 | Poor 84.4% |
| French | 13.8 /100 | #205 | Poor 84.4% |
| Lebanese | 10.6 /100 | #206 | Poor 84.4% |
| Bangladeshis | 9.4 /100 | #207 | Tragic 84.3% |
| Arabs | 8.9 /100 | #208 | Tragic 84.3% |
| Jamaicans | 8.8 /100 | #209 | Tragic 84.3% |
| Indonesians | 8.8 /100 | #210 | Tragic 84.3% |
| Japanese | 8.8 /100 | #211 | Tragic 84.3% |
| Immigrants | Western Asia | 8.2 /100 | #212 | Tragic 84.3% |
| Immigrants | Jamaica | 7.9 /100 | #213 | Tragic 84.3% |
| Immigrants | Germany | 7.2 /100 | #214 | Tragic 84.3% |
| Europeans | 7.2 /100 | #215 | Tragic 84.3% |
| Immigrants | Ecuador | 7.1 /100 | #216 | Tragic 84.3% |
| Immigrants | Trinidad and Tobago | 7.0 /100 | #217 | Tragic 84.3% |
Demographics Similar to Tohono O'odham by In Labor Force | Age 30-34
In terms of in labor force | age 30-34, the demographic groups most similar to Tohono O'odham are Immigrants from Yemen (78.2%, a difference of 0.57%), Lumbee (77.3%, a difference of 0.60%), Yuman (77.1%, a difference of 0.84%), Ute (78.9%, a difference of 1.5%), and Apache (79.0%, a difference of 1.7%).
| Demographics | Rating | Rank | In Labor Force | Age 30-34 |
| Inupiat | 0.0 /100 | #333 | Tragic 79.7% |
| Hopi | 0.0 /100 | #334 | Tragic 79.3% |
| Marshallese | 0.0 /100 | #335 | Tragic 79.2% |
| Natives/Alaskans | 0.0 /100 | #336 | Tragic 79.2% |
| Yakama | 0.0 /100 | #337 | Tragic 79.1% |
| Pima | 0.0 /100 | #338 | Tragic 79.0% |
| Apache | 0.0 /100 | #339 | Tragic 79.0% |
| Ute | 0.0 /100 | #340 | Tragic 78.9% |
| Immigrants | Yemen | 0.0 /100 | #341 | Tragic 78.2% |
| Tohono O'odham | 0.0 /100 | #342 | Tragic 77.7% |
| Lumbee | 0.0 /100 | #343 | Tragic 77.3% |
| Yuman | 0.0 /100 | #344 | Tragic 77.1% |
| Yup'ik | 0.0 /100 | #345 | Tragic 76.4% |
| Crow | 0.0 /100 | #346 | Tragic 75.9% |
| Navajo | 0.0 /100 | #347 | Tragic 73.8% |