Immigrants from Zimbabwe vs South American Indian In Labor Force | Age 20-64
COMPARE
Immigrants from Zimbabwe
South American Indian
In Labor Force | Age 20-64
In Labor Force | Age 20-64 Comparison
Immigrants from Zimbabwe
South American Indians
80.5%
IN LABOR FORCE | AGE 20-64
99.8/ 100
METRIC RATING
40th/ 347
METRIC RANK
79.9%
IN LABOR FORCE | AGE 20-64
87.6/ 100
METRIC RATING
133rd/ 347
METRIC RANK
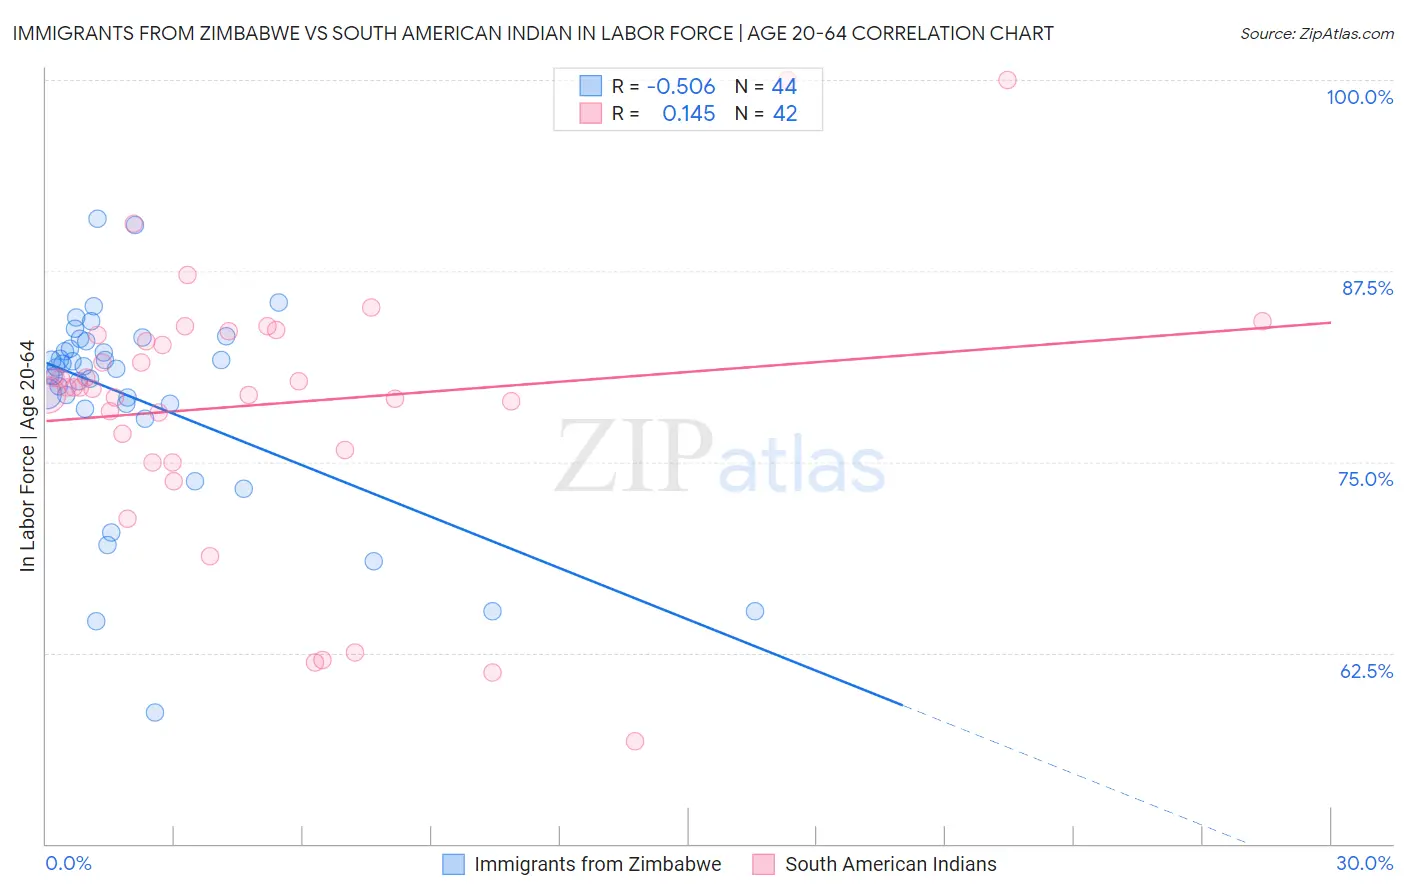
Immigrants from Zimbabwe vs South American Indian In Labor Force | Age 20-64 Correlation Chart
The statistical analysis conducted on geographies consisting of 117,813,548 people shows a substantial negative correlation between the proportion of Immigrants from Zimbabwe and labor force participation rate among population between the ages 20 and 64 in the United States with a correlation coefficient (R) of -0.506 and weighted average of 80.5%. Similarly, the statistical analysis conducted on geographies consisting of 164,560,196 people shows a poor positive correlation between the proportion of South American Indians and labor force participation rate among population between the ages 20 and 64 in the United States with a correlation coefficient (R) of 0.145 and weighted average of 79.9%, a difference of 0.85%.
In Labor Force | Age 20-64 Correlation Summary
| Measurement | Immigrants from Zimbabwe | South American Indian |
| Minimum | 58.6% | 56.7% |
| Maximum | 90.9% | 100.0% |
| Range | 32.3% | 43.3% |
| Mean | 79.1% | 78.8% |
| Median | 81.1% | 79.9% |
| Interquartile 25% (IQ1) | 78.6% | 75.8% |
| Interquartile 75% (IQ3) | 82.7% | 83.3% |
| Interquartile Range (IQR) | 4.0% | 7.5% |
| Standard Deviation (Sample) | 6.7% | 8.9% |
| Standard Deviation (Population) | 6.6% | 8.7% |
Similar Demographics by In Labor Force | Age 20-64
Demographics Similar to Immigrants from Zimbabwe by In Labor Force | Age 20-64
In terms of in labor force | age 20-64, the demographic groups most similar to Immigrants from Zimbabwe are Brazilian (80.5%, a difference of 0.0%), Ugandan (80.6%, a difference of 0.010%), Immigrants from Liberia (80.5%, a difference of 0.010%), Paraguayan (80.6%, a difference of 0.030%), and Immigrants from Moldova (80.6%, a difference of 0.030%).
| Demographics | Rating | Rank | In Labor Force | Age 20-64 |
| Chinese | 99.9 /100 | #33 | Exceptional 80.7% |
| Immigrants | Brazil | 99.9 /100 | #34 | Exceptional 80.7% |
| Immigrants | Poland | 99.9 /100 | #35 | Exceptional 80.6% |
| Paraguayans | 99.8 /100 | #36 | Exceptional 80.6% |
| Immigrants | Moldova | 99.8 /100 | #37 | Exceptional 80.6% |
| Ugandans | 99.8 /100 | #38 | Exceptional 80.6% |
| Brazilians | 99.8 /100 | #39 | Exceptional 80.5% |
| Immigrants | Zimbabwe | 99.8 /100 | #40 | Exceptional 80.5% |
| Immigrants | Liberia | 99.8 /100 | #41 | Exceptional 80.5% |
| Latvians | 99.8 /100 | #42 | Exceptional 80.5% |
| Czechs | 99.7 /100 | #43 | Exceptional 80.5% |
| Immigrants | Middle Africa | 99.7 /100 | #44 | Exceptional 80.5% |
| Slovenes | 99.7 /100 | #45 | Exceptional 80.5% |
| Immigrants | Pakistan | 99.6 /100 | #46 | Exceptional 80.5% |
| Immigrants | Africa | 99.6 /100 | #47 | Exceptional 80.4% |
Demographics Similar to South American Indians by In Labor Force | Age 20-64
In terms of in labor force | age 20-64, the demographic groups most similar to South American Indians are Indian (Asian) (79.9%, a difference of 0.0%), Belgian (79.9%, a difference of 0.0%), Immigrants from Iran (79.9%, a difference of 0.010%), Ukrainian (79.9%, a difference of 0.010%), and Italian (79.9%, a difference of 0.020%).
| Demographics | Rating | Rank | In Labor Force | Age 20-64 |
| Immigrants | France | 90.7 /100 | #126 | Exceptional 79.9% |
| Immigrants | Czechoslovakia | 89.7 /100 | #127 | Excellent 79.9% |
| Immigrants | Eastern Asia | 89.4 /100 | #128 | Excellent 79.9% |
| Italians | 88.9 /100 | #129 | Excellent 79.9% |
| Immigrants | Zaire | 88.6 /100 | #130 | Excellent 79.9% |
| Immigrants | Iran | 88.3 /100 | #131 | Excellent 79.9% |
| Indians (Asian) | 87.7 /100 | #132 | Excellent 79.9% |
| South American Indians | 87.6 /100 | #133 | Excellent 79.9% |
| Belgians | 87.4 /100 | #134 | Excellent 79.9% |
| Ukrainians | 86.8 /100 | #135 | Excellent 79.9% |
| Immigrants | Singapore | 86.7 /100 | #136 | Excellent 79.9% |
| Immigrants | Ukraine | 86.5 /100 | #137 | Excellent 79.9% |
| Immigrants | Nigeria | 86.4 /100 | #138 | Excellent 79.9% |
| Immigrants | Spain | 83.9 /100 | #139 | Excellent 79.8% |
| Immigrants | South Eastern Asia | 80.4 /100 | #140 | Excellent 79.8% |