Immigrants from Zaire vs Immigrants from Kazakhstan In Labor Force | Age 35-44
COMPARE
Immigrants from Zaire
Immigrants from Kazakhstan
In Labor Force | Age 35-44
In Labor Force | Age 35-44 Comparison
Immigrants from Zaire
Immigrants from Kazakhstan
84.6%
IN LABOR FORCE | AGE 35-44
82.5/ 100
METRIC RATING
139th/ 347
METRIC RANK
84.4%
IN LABOR FORCE | AGE 35-44
60.4/ 100
METRIC RATING
160th/ 347
METRIC RANK
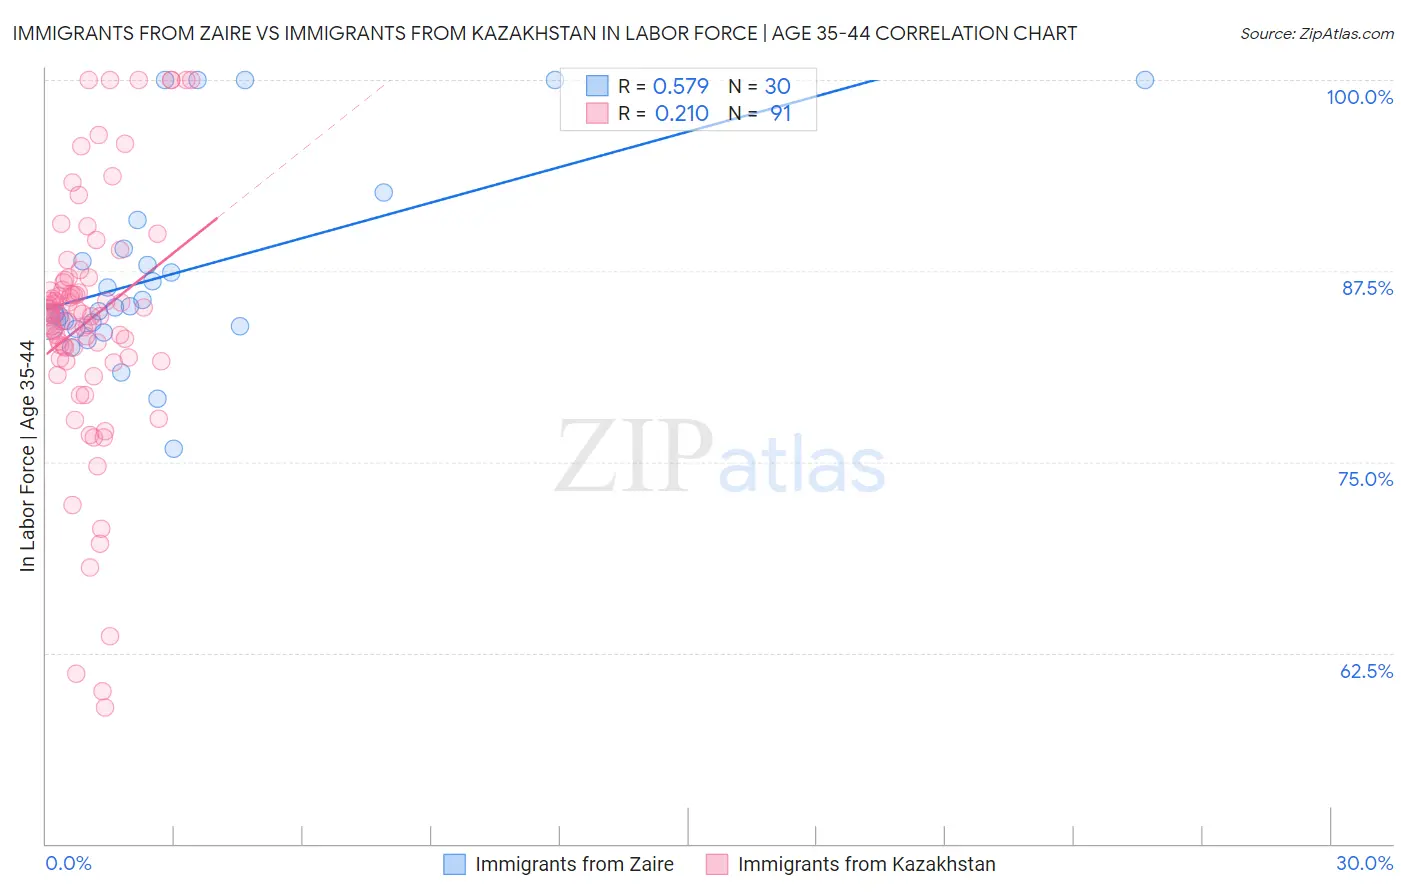
Immigrants from Zaire vs Immigrants from Kazakhstan In Labor Force | Age 35-44 Correlation Chart
The statistical analysis conducted on geographies consisting of 107,245,856 people shows a substantial positive correlation between the proportion of Immigrants from Zaire and labor force participation rate among population between the ages 35 and 44 in the United States with a correlation coefficient (R) of 0.579 and weighted average of 84.6%. Similarly, the statistical analysis conducted on geographies consisting of 124,390,688 people shows a weak positive correlation between the proportion of Immigrants from Kazakhstan and labor force participation rate among population between the ages 35 and 44 in the United States with a correlation coefficient (R) of 0.210 and weighted average of 84.4%, a difference of 0.18%.
In Labor Force | Age 35-44 Correlation Summary
| Measurement | Immigrants from Zaire | Immigrants from Kazakhstan |
| Minimum | 75.9% | 58.9% |
| Maximum | 100.0% | 100.0% |
| Range | 24.1% | 41.1% |
| Mean | 87.5% | 84.2% |
| Median | 85.2% | 84.7% |
| Interquartile 25% (IQ1) | 83.9% | 81.8% |
| Interquartile 75% (IQ3) | 89.0% | 86.9% |
| Interquartile Range (IQR) | 5.0% | 5.1% |
| Standard Deviation (Sample) | 6.5% | 8.3% |
| Standard Deviation (Population) | 6.4% | 8.2% |
Similar Demographics by In Labor Force | Age 35-44
Demographics Similar to Immigrants from Zaire by In Labor Force | Age 35-44
In terms of in labor force | age 35-44, the demographic groups most similar to Immigrants from Zaire are Czechoslovakian (84.6%, a difference of 0.0%), Immigrants from Japan (84.6%, a difference of 0.010%), Immigrants from Chile (84.6%, a difference of 0.020%), Immigrants from Belgium (84.6%, a difference of 0.020%), and Immigrants from Uruguay (84.6%, a difference of 0.030%).
| Demographics | Rating | Rank | In Labor Force | Age 35-44 |
| Austrians | 89.4 /100 | #132 | Excellent 84.7% |
| Argentineans | 88.4 /100 | #133 | Excellent 84.6% |
| Immigrants | Korea | 88.2 /100 | #134 | Excellent 84.6% |
| Immigrants | Malaysia | 87.5 /100 | #135 | Excellent 84.6% |
| Afghans | 86.3 /100 | #136 | Excellent 84.6% |
| Immigrants | Chile | 84.6 /100 | #137 | Excellent 84.6% |
| Czechoslovakians | 82.6 /100 | #138 | Excellent 84.6% |
| Immigrants | Zaire | 82.5 /100 | #139 | Excellent 84.6% |
| Immigrants | Japan | 81.4 /100 | #140 | Excellent 84.6% |
| Immigrants | Belgium | 80.8 /100 | #141 | Excellent 84.6% |
| Immigrants | Uruguay | 80.1 /100 | #142 | Excellent 84.6% |
| Immigrants | Ukraine | 79.7 /100 | #143 | Good 84.6% |
| Immigrants | Jamaica | 79.4 /100 | #144 | Good 84.6% |
| Immigrants | Saudi Arabia | 79.4 /100 | #145 | Good 84.6% |
| Immigrants | Asia | 78.7 /100 | #146 | Good 84.5% |
Demographics Similar to Immigrants from Kazakhstan by In Labor Force | Age 35-44
In terms of in labor force | age 35-44, the demographic groups most similar to Immigrants from Kazakhstan are Immigrants from Senegal (84.4%, a difference of 0.0%), Immigrants from Venezuela (84.4%, a difference of 0.0%), Immigrants from Hungary (84.4%, a difference of 0.010%), Aleut (84.4%, a difference of 0.010%), and Nigerian (84.4%, a difference of 0.010%).
| Demographics | Rating | Rank | In Labor Force | Age 35-44 |
| Trinidadians and Tobagonians | 69.5 /100 | #153 | Good 84.5% |
| Iranians | 69.4 /100 | #154 | Good 84.5% |
| Immigrants | Switzerland | 65.9 /100 | #155 | Good 84.5% |
| Immigrants | Israel | 64.3 /100 | #156 | Good 84.4% |
| Immigrants | Austria | 63.8 /100 | #157 | Good 84.4% |
| Jamaicans | 62.7 /100 | #158 | Good 84.4% |
| Immigrants | Senegal | 60.4 /100 | #159 | Good 84.4% |
| Immigrants | Kazakhstan | 60.4 /100 | #160 | Good 84.4% |
| Immigrants | Venezuela | 60.0 /100 | #161 | Good 84.4% |
| Immigrants | Hungary | 59.4 /100 | #162 | Average 84.4% |
| Aleuts | 59.1 /100 | #163 | Average 84.4% |
| Nigerians | 58.9 /100 | #164 | Average 84.4% |
| Venezuelans | 58.1 /100 | #165 | Average 84.4% |
| Alsatians | 55.2 /100 | #166 | Average 84.4% |
| Immigrants | Portugal | 55.2 /100 | #167 | Average 84.4% |