Celtic vs White/Caucasian In Labor Force | Age 35-44
COMPARE
Celtic
White/Caucasian
In Labor Force | Age 35-44
In Labor Force | Age 35-44 Comparison
Celtics
Whites/Caucasians
83.8%
IN LABOR FORCE | AGE 35-44
1.4/ 100
METRIC RATING
239th/ 347
METRIC RANK
83.6%
IN LABOR FORCE | AGE 35-44
0.5/ 100
METRIC RATING
250th/ 347
METRIC RANK
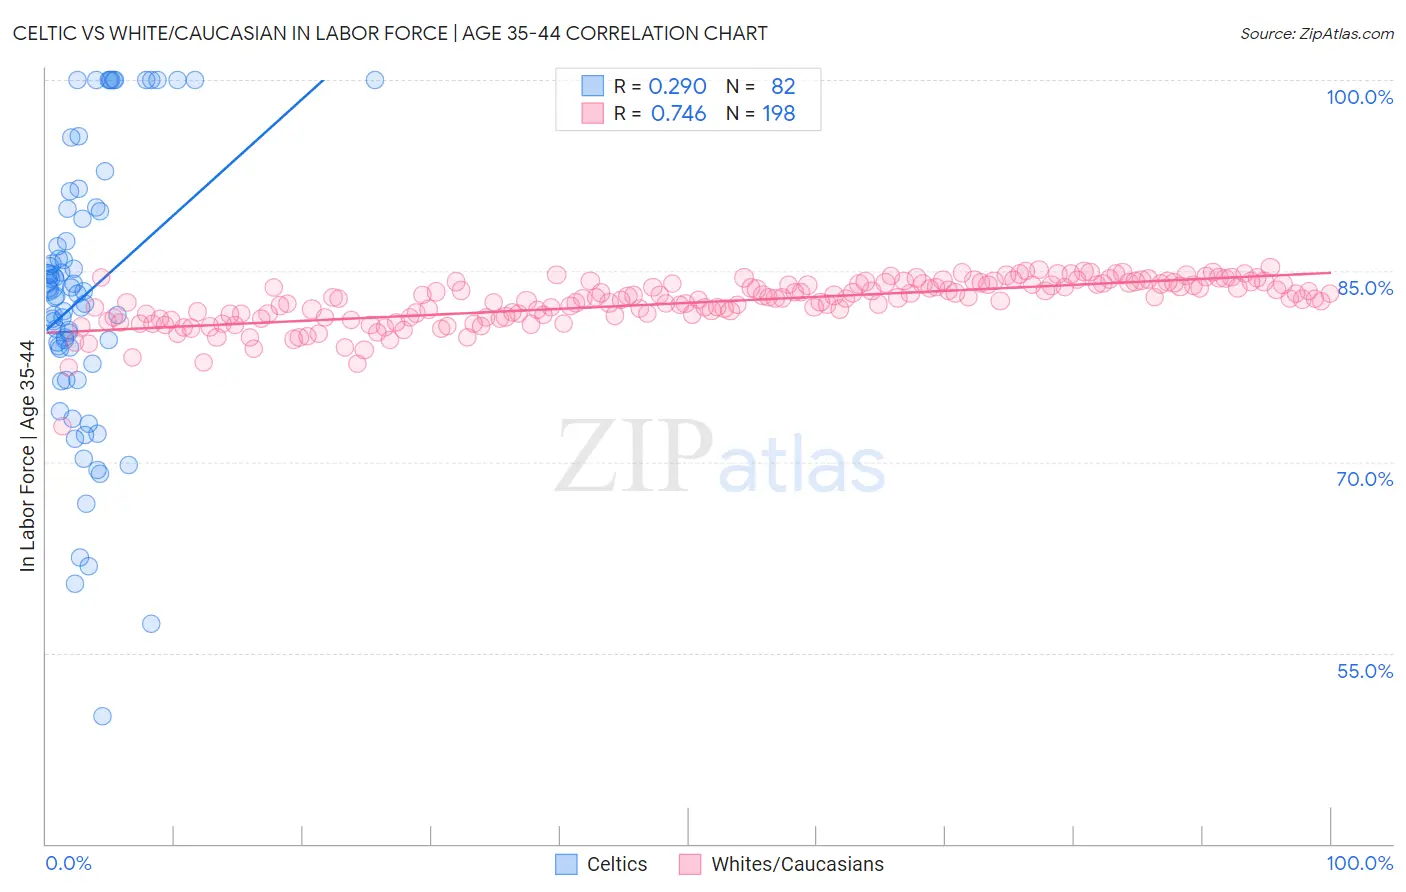
Celtic vs White/Caucasian In Labor Force | Age 35-44 Correlation Chart
The statistical analysis conducted on geographies consisting of 168,864,991 people shows a weak positive correlation between the proportion of Celtics and labor force participation rate among population between the ages 35 and 44 in the United States with a correlation coefficient (R) of 0.290 and weighted average of 83.8%. Similarly, the statistical analysis conducted on geographies consisting of 583,820,573 people shows a strong positive correlation between the proportion of Whites/Caucasians and labor force participation rate among population between the ages 35 and 44 in the United States with a correlation coefficient (R) of 0.746 and weighted average of 83.6%, a difference of 0.17%.
In Labor Force | Age 35-44 Correlation Summary
| Measurement | Celtic | White/Caucasian |
| Minimum | 50.0% | 72.8% |
| Maximum | 100.0% | 85.3% |
| Range | 50.0% | 12.5% |
| Mean | 83.1% | 82.5% |
| Median | 83.3% | 82.8% |
| Interquartile 25% (IQ1) | 78.9% | 81.4% |
| Interquartile 75% (IQ3) | 89.7% | 84.0% |
| Interquartile Range (IQR) | 10.9% | 2.6% |
| Standard Deviation (Sample) | 10.9% | 1.8% |
| Standard Deviation (Population) | 10.8% | 1.8% |
Demographics Similar to Celtics and Whites/Caucasians by In Labor Force | Age 35-44
In terms of in labor force | age 35-44, the demographic groups most similar to Celtics are Arab (83.8%, a difference of 0.0%), Iraqi (83.8%, a difference of 0.010%), Immigrants from Laos (83.8%, a difference of 0.030%), Immigrants from Cambodia (83.8%, a difference of 0.030%), and Immigrants from Western Asia (83.8%, a difference of 0.030%). Similarly, the demographic groups most similar to Whites/Caucasians are Salvadoran (83.6%, a difference of 0.020%), Immigrants from Guyana (83.6%, a difference of 0.020%), Lebanese (83.6%, a difference of 0.020%), Tongan (83.6%, a difference of 0.030%), and Immigrants from St. Vincent and the Grenadines (83.7%, a difference of 0.060%).
| Demographics | Rating | Rank | In Labor Force | Age 35-44 |
| Immigrants | Oceania | 2.6 /100 | #234 | Tragic 83.9% |
| Immigrants | Syria | 2.5 /100 | #235 | Tragic 83.9% |
| West Indians | 2.4 /100 | #236 | Tragic 83.9% |
| English | 1.8 /100 | #237 | Tragic 83.8% |
| Immigrants | Laos | 1.7 /100 | #238 | Tragic 83.8% |
| Celtics | 1.4 /100 | #239 | Tragic 83.8% |
| Arabs | 1.3 /100 | #240 | Tragic 83.8% |
| Iraqis | 1.3 /100 | #241 | Tragic 83.8% |
| Immigrants | Cambodia | 1.1 /100 | #242 | Tragic 83.8% |
| Immigrants | Western Asia | 1.1 /100 | #243 | Tragic 83.8% |
| Guyanese | 1.1 /100 | #244 | Tragic 83.8% |
| Malaysians | 1.1 /100 | #245 | Tragic 83.8% |
| Immigrants | Immigrants | 1.0 /100 | #246 | Tragic 83.7% |
| Immigrants | Armenia | 0.9 /100 | #247 | Tragic 83.7% |
| Indonesians | 0.8 /100 | #248 | Tragic 83.7% |
| Immigrants | St. Vincent and the Grenadines | 0.7 /100 | #249 | Tragic 83.7% |
| Whites/Caucasians | 0.5 /100 | #250 | Tragic 83.6% |
| Salvadorans | 0.4 /100 | #251 | Tragic 83.6% |
| Immigrants | Guyana | 0.4 /100 | #252 | Tragic 83.6% |
| Lebanese | 0.4 /100 | #253 | Tragic 83.6% |
| Tongans | 0.4 /100 | #254 | Tragic 83.6% |