Immigrants from Belgium vs Macedonian In Labor Force | Age 25-29
COMPARE
Immigrants from Belgium
Macedonian
In Labor Force | Age 25-29
In Labor Force | Age 25-29 Comparison
Immigrants from Belgium
Macedonians
84.6%
IN LABOR FORCE | AGE 25-29
35.0/ 100
METRIC RATING
186th/ 347
METRIC RANK
85.7%
IN LABOR FORCE | AGE 25-29
99.9/ 100
METRIC RATING
44th/ 347
METRIC RANK
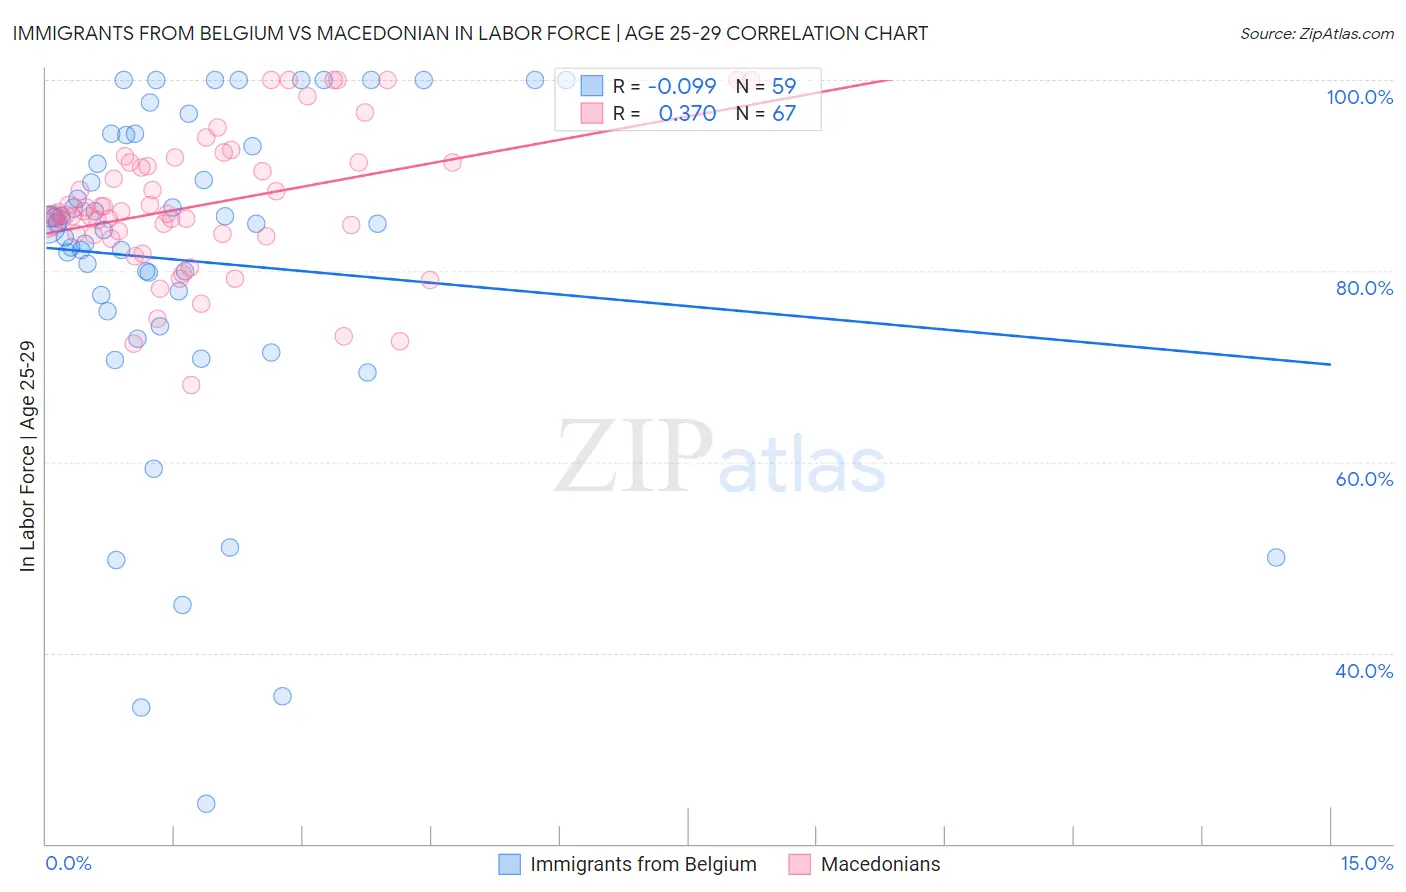
Immigrants from Belgium vs Macedonian In Labor Force | Age 25-29 Correlation Chart
The statistical analysis conducted on geographies consisting of 146,686,004 people shows a slight negative correlation between the proportion of Immigrants from Belgium and labor force participation rate among population between the ages 25 and 29 in the United States with a correlation coefficient (R) of -0.099 and weighted average of 84.6%. Similarly, the statistical analysis conducted on geographies consisting of 132,648,005 people shows a mild positive correlation between the proportion of Macedonians and labor force participation rate among population between the ages 25 and 29 in the United States with a correlation coefficient (R) of 0.370 and weighted average of 85.7%, a difference of 1.3%.
In Labor Force | Age 25-29 Correlation Summary
| Measurement | Immigrants from Belgium | Macedonian |
| Minimum | 24.2% | 68.1% |
| Maximum | 100.0% | 100.0% |
| Range | 75.8% | 31.9% |
| Mean | 81.0% | 86.9% |
| Median | 85.0% | 85.9% |
| Interquartile 25% (IQ1) | 75.8% | 83.7% |
| Interquartile 75% (IQ3) | 94.2% | 91.4% |
| Interquartile Range (IQR) | 18.4% | 7.7% |
| Standard Deviation (Sample) | 17.6% | 7.3% |
| Standard Deviation (Population) | 17.5% | 7.2% |
Similar Demographics by In Labor Force | Age 25-29
Demographics Similar to Immigrants from Belgium by In Labor Force | Age 25-29
In terms of in labor force | age 25-29, the demographic groups most similar to Immigrants from Belgium are Immigrants from Portugal (84.6%, a difference of 0.0%), Immigrants from Ukraine (84.5%, a difference of 0.010%), Immigrants from Denmark (84.6%, a difference of 0.020%), Moroccan (84.5%, a difference of 0.020%), and Immigrants from Kuwait (84.6%, a difference of 0.030%).
| Demographics | Rating | Rank | In Labor Force | Age 25-29 |
| Immigrants | Argentina | 44.0 /100 | #179 | Average 84.6% |
| Immigrants | South America | 42.9 /100 | #180 | Average 84.6% |
| Immigrants | Norway | 41.9 /100 | #181 | Average 84.6% |
| Europeans | 40.3 /100 | #182 | Average 84.6% |
| Scottish | 40.1 /100 | #183 | Average 84.6% |
| Immigrants | Kuwait | 38.2 /100 | #184 | Fair 84.6% |
| Immigrants | Denmark | 37.0 /100 | #185 | Fair 84.6% |
| Immigrants | Belgium | 35.0 /100 | #186 | Fair 84.6% |
| Immigrants | Portugal | 34.7 /100 | #187 | Fair 84.6% |
| Immigrants | Ukraine | 33.7 /100 | #188 | Fair 84.5% |
| Moroccans | 32.6 /100 | #189 | Fair 84.5% |
| Welsh | 31.1 /100 | #190 | Fair 84.5% |
| Zimbabweans | 28.7 /100 | #191 | Fair 84.5% |
| English | 25.8 /100 | #192 | Fair 84.5% |
| South American Indians | 25.0 /100 | #193 | Fair 84.5% |
Demographics Similar to Macedonians by In Labor Force | Age 25-29
In terms of in labor force | age 25-29, the demographic groups most similar to Macedonians are Immigrants from Sierra Leone (85.7%, a difference of 0.0%), Immigrants from India (85.7%, a difference of 0.010%), Immigrants from Eritrea (85.7%, a difference of 0.020%), Czech (85.6%, a difference of 0.030%), and Immigrants from Greece (85.7%, a difference of 0.060%).
| Demographics | Rating | Rank | In Labor Force | Age 25-29 |
| Poles | 99.9 /100 | #37 | Exceptional 85.8% |
| Sierra Leoneans | 99.9 /100 | #38 | Exceptional 85.8% |
| Croatians | 99.9 /100 | #39 | Exceptional 85.8% |
| Immigrants | Albania | 99.9 /100 | #40 | Exceptional 85.7% |
| Immigrants | Greece | 99.9 /100 | #41 | Exceptional 85.7% |
| Immigrants | Eritrea | 99.9 /100 | #42 | Exceptional 85.7% |
| Immigrants | India | 99.9 /100 | #43 | Exceptional 85.7% |
| Macedonians | 99.9 /100 | #44 | Exceptional 85.7% |
| Immigrants | Sierra Leone | 99.9 /100 | #45 | Exceptional 85.7% |
| Czechs | 99.8 /100 | #46 | Exceptional 85.6% |
| Turks | 99.8 /100 | #47 | Exceptional 85.6% |
| Italians | 99.8 /100 | #48 | Exceptional 85.6% |
| Swedes | 99.8 /100 | #49 | Exceptional 85.6% |
| Yugoslavians | 99.8 /100 | #50 | Exceptional 85.6% |
| Immigrants | Latvia | 99.8 /100 | #51 | Exceptional 85.6% |