French Canadian vs Macedonian In Labor Force | Age 25-29
COMPARE
French Canadian
Macedonian
In Labor Force | Age 25-29
In Labor Force | Age 25-29 Comparison
French Canadians
Macedonians
85.2%
IN LABOR FORCE | AGE 25-29
96.5/ 100
METRIC RATING
87th/ 347
METRIC RANK
85.7%
IN LABOR FORCE | AGE 25-29
99.9/ 100
METRIC RATING
44th/ 347
METRIC RANK
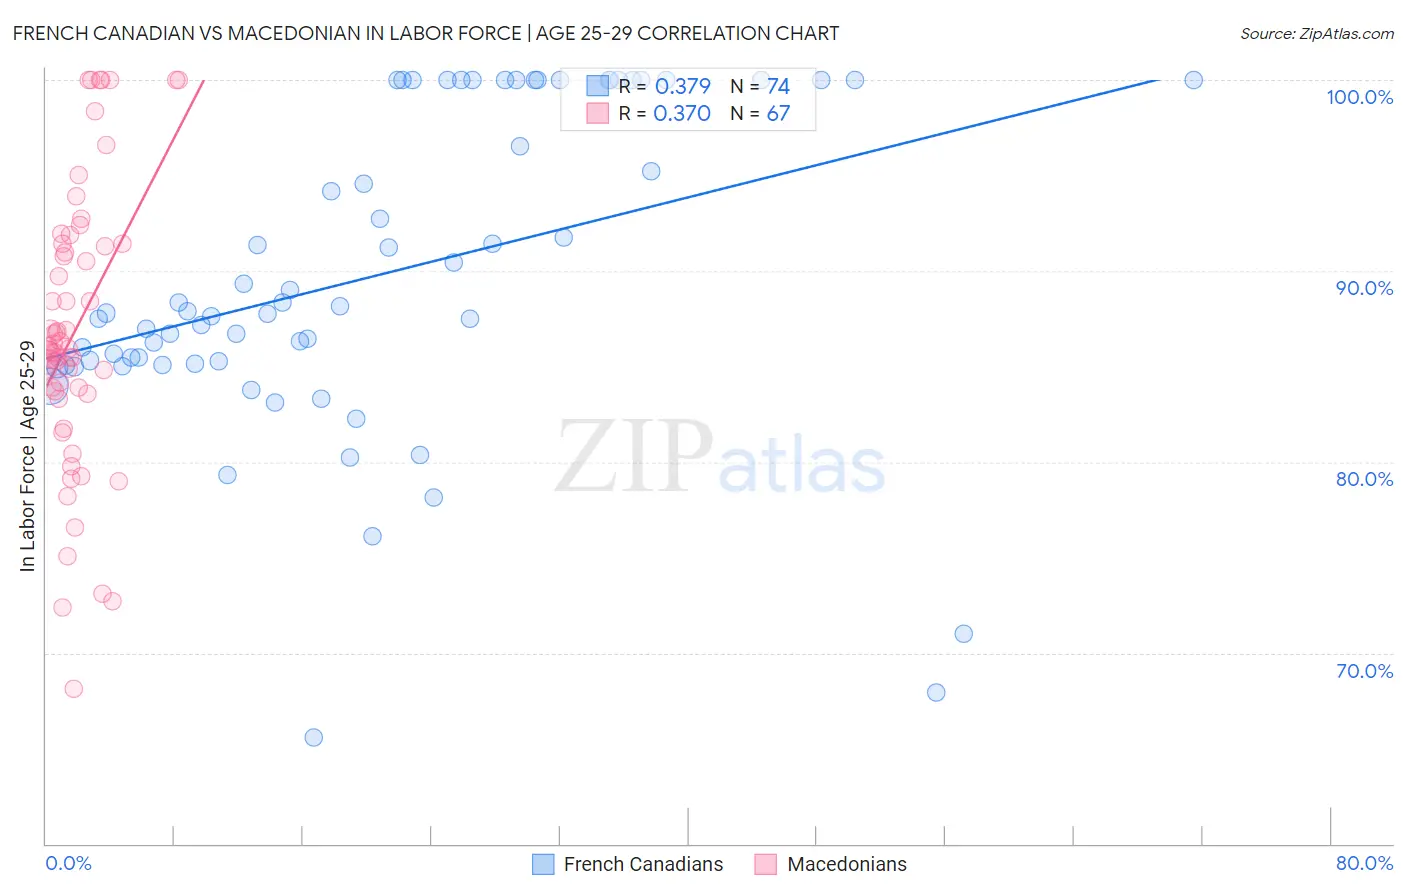
French Canadian vs Macedonian In Labor Force | Age 25-29 Correlation Chart
The statistical analysis conducted on geographies consisting of 502,121,240 people shows a mild positive correlation between the proportion of French Canadians and labor force participation rate among population between the ages 25 and 29 in the United States with a correlation coefficient (R) of 0.379 and weighted average of 85.2%. Similarly, the statistical analysis conducted on geographies consisting of 132,648,005 people shows a mild positive correlation between the proportion of Macedonians and labor force participation rate among population between the ages 25 and 29 in the United States with a correlation coefficient (R) of 0.370 and weighted average of 85.7%, a difference of 0.60%.
In Labor Force | Age 25-29 Correlation Summary
| Measurement | French Canadian | Macedonian |
| Minimum | 65.6% | 68.1% |
| Maximum | 100.0% | 100.0% |
| Range | 34.4% | 31.9% |
| Mean | 89.8% | 86.9% |
| Median | 87.8% | 85.9% |
| Interquartile 25% (IQ1) | 85.1% | 83.7% |
| Interquartile 75% (IQ3) | 100.0% | 91.4% |
| Interquartile Range (IQR) | 14.9% | 7.7% |
| Standard Deviation (Sample) | 8.2% | 7.3% |
| Standard Deviation (Population) | 8.2% | 7.2% |
Similar Demographics by In Labor Force | Age 25-29
Demographics Similar to French Canadians by In Labor Force | Age 25-29
In terms of in labor force | age 25-29, the demographic groups most similar to French Canadians are Immigrants from Croatia (85.2%, a difference of 0.0%), Immigrants from Eastern Europe (85.2%, a difference of 0.010%), Immigrants from Africa (85.2%, a difference of 0.010%), Ukrainian (85.2%, a difference of 0.010%), and Immigrants from France (85.2%, a difference of 0.010%).
| Demographics | Rating | Rank | In Labor Force | Age 25-29 |
| Immigrants | Zimbabwe | 97.6 /100 | #80 | Exceptional 85.2% |
| Immigrants | Northern Europe | 97.2 /100 | #81 | Exceptional 85.2% |
| Okinawans | 97.0 /100 | #82 | Exceptional 85.2% |
| Immigrants | Europe | 96.8 /100 | #83 | Exceptional 85.2% |
| Immigrants | Eastern Europe | 96.8 /100 | #84 | Exceptional 85.2% |
| Immigrants | Africa | 96.7 /100 | #85 | Exceptional 85.2% |
| Ukrainians | 96.7 /100 | #86 | Exceptional 85.2% |
| French Canadians | 96.5 /100 | #87 | Exceptional 85.2% |
| Immigrants | Croatia | 96.4 /100 | #88 | Exceptional 85.2% |
| Immigrants | France | 96.3 /100 | #89 | Exceptional 85.2% |
| Burmese | 95.9 /100 | #90 | Exceptional 85.1% |
| Immigrants | Moldova | 95.8 /100 | #91 | Exceptional 85.1% |
| Immigrants | Costa Rica | 95.5 /100 | #92 | Exceptional 85.1% |
| Austrians | 95.3 /100 | #93 | Exceptional 85.1% |
| Immigrants | Korea | 94.8 /100 | #94 | Exceptional 85.1% |
Demographics Similar to Macedonians by In Labor Force | Age 25-29
In terms of in labor force | age 25-29, the demographic groups most similar to Macedonians are Immigrants from Sierra Leone (85.7%, a difference of 0.0%), Immigrants from India (85.7%, a difference of 0.010%), Immigrants from Eritrea (85.7%, a difference of 0.020%), Czech (85.6%, a difference of 0.030%), and Immigrants from Greece (85.7%, a difference of 0.060%).
| Demographics | Rating | Rank | In Labor Force | Age 25-29 |
| Poles | 99.9 /100 | #37 | Exceptional 85.8% |
| Sierra Leoneans | 99.9 /100 | #38 | Exceptional 85.8% |
| Croatians | 99.9 /100 | #39 | Exceptional 85.8% |
| Immigrants | Albania | 99.9 /100 | #40 | Exceptional 85.7% |
| Immigrants | Greece | 99.9 /100 | #41 | Exceptional 85.7% |
| Immigrants | Eritrea | 99.9 /100 | #42 | Exceptional 85.7% |
| Immigrants | India | 99.9 /100 | #43 | Exceptional 85.7% |
| Macedonians | 99.9 /100 | #44 | Exceptional 85.7% |
| Immigrants | Sierra Leone | 99.9 /100 | #45 | Exceptional 85.7% |
| Czechs | 99.8 /100 | #46 | Exceptional 85.6% |
| Turks | 99.8 /100 | #47 | Exceptional 85.6% |
| Italians | 99.8 /100 | #48 | Exceptional 85.6% |
| Swedes | 99.8 /100 | #49 | Exceptional 85.6% |
| Yugoslavians | 99.8 /100 | #50 | Exceptional 85.6% |
| Immigrants | Latvia | 99.8 /100 | #51 | Exceptional 85.6% |