Immigrants from Western Africa vs Immigrants from Egypt In Labor Force | Age 20-64
COMPARE
Immigrants from Western Africa
Immigrants from Egypt
In Labor Force | Age 20-64
In Labor Force | Age 20-64 Comparison
Immigrants from Western Africa
Immigrants from Egypt
80.0%
IN LABOR FORCE | AGE 20-64
93.1/ 100
METRIC RATING
116th/ 347
METRIC RANK
80.1%
IN LABOR FORCE | AGE 20-64
97.1/ 100
METRIC RATING
86th/ 347
METRIC RANK
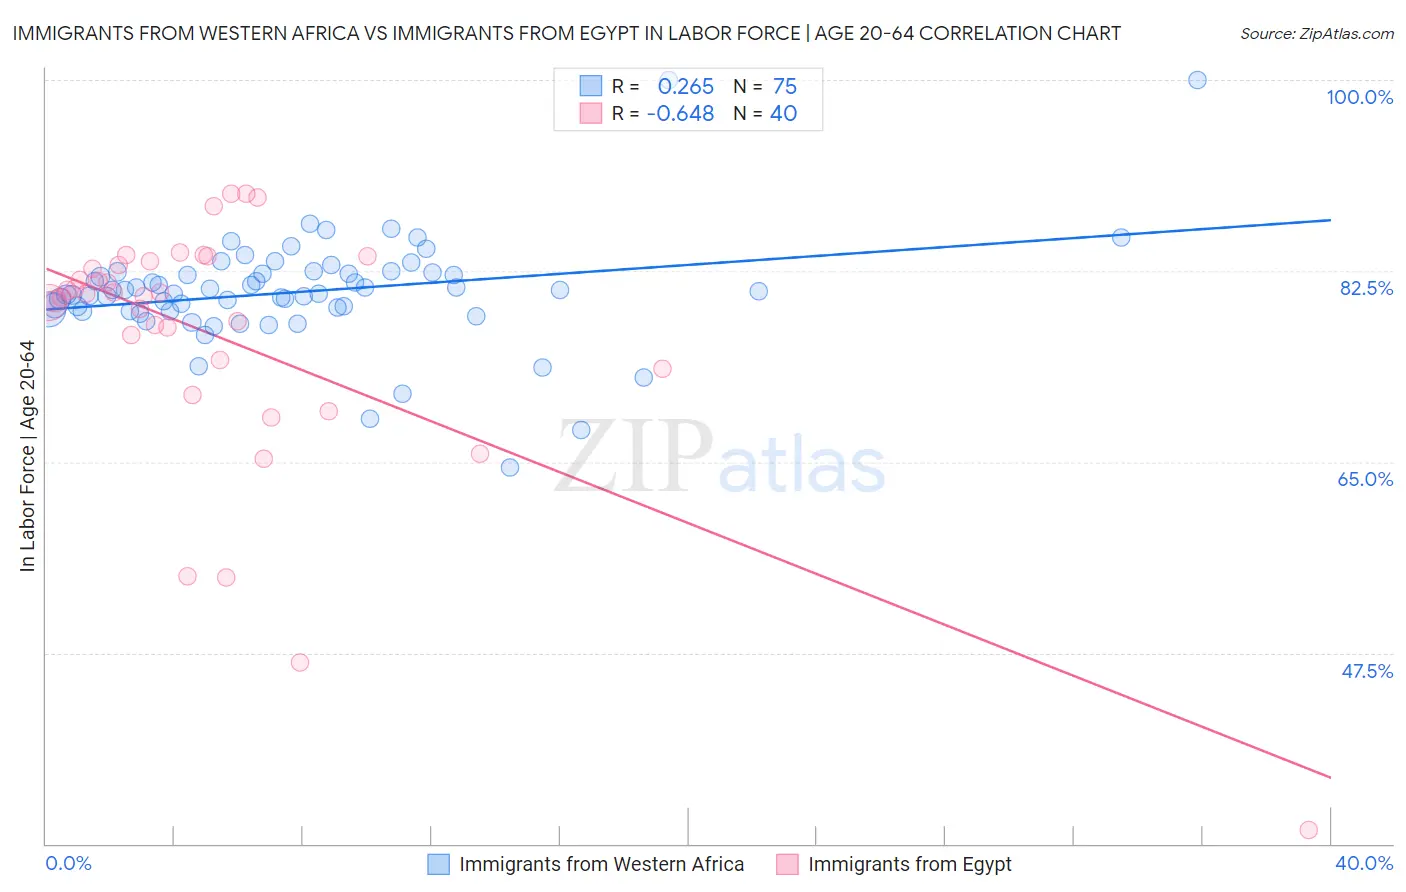
Immigrants from Western Africa vs Immigrants from Egypt In Labor Force | Age 20-64 Correlation Chart
The statistical analysis conducted on geographies consisting of 357,882,124 people shows a weak positive correlation between the proportion of Immigrants from Western Africa and labor force participation rate among population between the ages 20 and 64 in the United States with a correlation coefficient (R) of 0.265 and weighted average of 80.0%. Similarly, the statistical analysis conducted on geographies consisting of 245,492,161 people shows a significant negative correlation between the proportion of Immigrants from Egypt and labor force participation rate among population between the ages 20 and 64 in the United States with a correlation coefficient (R) of -0.648 and weighted average of 80.1%, a difference of 0.18%.
In Labor Force | Age 20-64 Correlation Summary
| Measurement | Immigrants from Western Africa | Immigrants from Egypt |
| Minimum | 64.5% | 31.3% |
| Maximum | 100.0% | 89.6% |
| Range | 35.5% | 58.3% |
| Mean | 80.6% | 76.4% |
| Median | 80.6% | 80.3% |
| Interquartile 25% (IQ1) | 78.8% | 73.9% |
| Interquartile 75% (IQ3) | 82.3% | 83.2% |
| Interquartile Range (IQR) | 3.5% | 9.3% |
| Standard Deviation (Sample) | 5.1% | 11.9% |
| Standard Deviation (Population) | 5.1% | 11.8% |
Similar Demographics by In Labor Force | Age 20-64
Demographics Similar to Immigrants from Western Africa by In Labor Force | Age 20-64
In terms of in labor force | age 20-64, the demographic groups most similar to Immigrants from Western Africa are Bermudan (80.0%, a difference of 0.010%), Immigrants from Vietnam (80.0%, a difference of 0.010%), Cape Verdean (80.0%, a difference of 0.010%), Argentinean (80.0%, a difference of 0.020%), and Immigrants from Taiwan (80.0%, a difference of 0.020%).
| Demographics | Rating | Rank | In Labor Force | Age 20-64 |
| Immigrants | Argentina | 94.1 /100 | #109 | Exceptional 80.0% |
| Estonians | 94.0 /100 | #110 | Exceptional 80.0% |
| Immigrants | South America | 93.9 /100 | #111 | Exceptional 80.0% |
| Immigrants | Italy | 93.9 /100 | #112 | Exceptional 80.0% |
| Sri Lankans | 93.9 /100 | #113 | Exceptional 80.0% |
| Argentineans | 93.8 /100 | #114 | Exceptional 80.0% |
| Bermudans | 93.3 /100 | #115 | Exceptional 80.0% |
| Immigrants | Western Africa | 93.1 /100 | #116 | Exceptional 80.0% |
| Immigrants | Vietnam | 92.7 /100 | #117 | Exceptional 80.0% |
| Cape Verdeans | 92.7 /100 | #118 | Exceptional 80.0% |
| Immigrants | Taiwan | 92.5 /100 | #119 | Exceptional 80.0% |
| Maltese | 92.4 /100 | #120 | Exceptional 80.0% |
| Immigrants | Kuwait | 92.2 /100 | #121 | Exceptional 80.0% |
| Mongolians | 92.0 /100 | #122 | Exceptional 79.9% |
| Immigrants | Russia | 91.8 /100 | #123 | Exceptional 79.9% |
Demographics Similar to Immigrants from Egypt by In Labor Force | Age 20-64
In terms of in labor force | age 20-64, the demographic groups most similar to Immigrants from Egypt are Jordanian (80.1%, a difference of 0.0%), Croatian (80.1%, a difference of 0.0%), German Russian (80.1%, a difference of 0.010%), Immigrants from Japan (80.1%, a difference of 0.010%), and Colombian (80.1%, a difference of 0.010%).
| Demographics | Rating | Rank | In Labor Force | Age 20-64 |
| Asians | 97.7 /100 | #79 | Exceptional 80.2% |
| Immigrants | Croatia | 97.6 /100 | #80 | Exceptional 80.1% |
| German Russians | 97.3 /100 | #81 | Exceptional 80.1% |
| Immigrants | Japan | 97.3 /100 | #82 | Exceptional 80.1% |
| Colombians | 97.3 /100 | #83 | Exceptional 80.1% |
| Immigrants | Latvia | 97.2 /100 | #84 | Exceptional 80.1% |
| Jordanians | 97.2 /100 | #85 | Exceptional 80.1% |
| Immigrants | Egypt | 97.1 /100 | #86 | Exceptional 80.1% |
| Croatians | 97.1 /100 | #87 | Exceptional 80.1% |
| Chileans | 97.0 /100 | #88 | Exceptional 80.1% |
| Immigrants | Venezuela | 96.8 /100 | #89 | Exceptional 80.1% |
| Poles | 96.8 /100 | #90 | Exceptional 80.1% |
| Uruguayans | 96.7 /100 | #91 | Exceptional 80.1% |
| Ghanaians | 96.7 /100 | #92 | Exceptional 80.1% |
| Immigrants | Belarus | 96.4 /100 | #93 | Exceptional 80.1% |