Immigrants from West Indies vs Slovene In Labor Force | Age 30-34
COMPARE
Immigrants from West Indies
Slovene
In Labor Force | Age 30-34
In Labor Force | Age 30-34 Comparison
Immigrants from West Indies
Slovenes
84.5%
IN LABOR FORCE | AGE 30-34
18.1/ 100
METRIC RATING
202nd/ 347
METRIC RANK
85.6%
IN LABOR FORCE | AGE 30-34
99.7/ 100
METRIC RATING
52nd/ 347
METRIC RANK
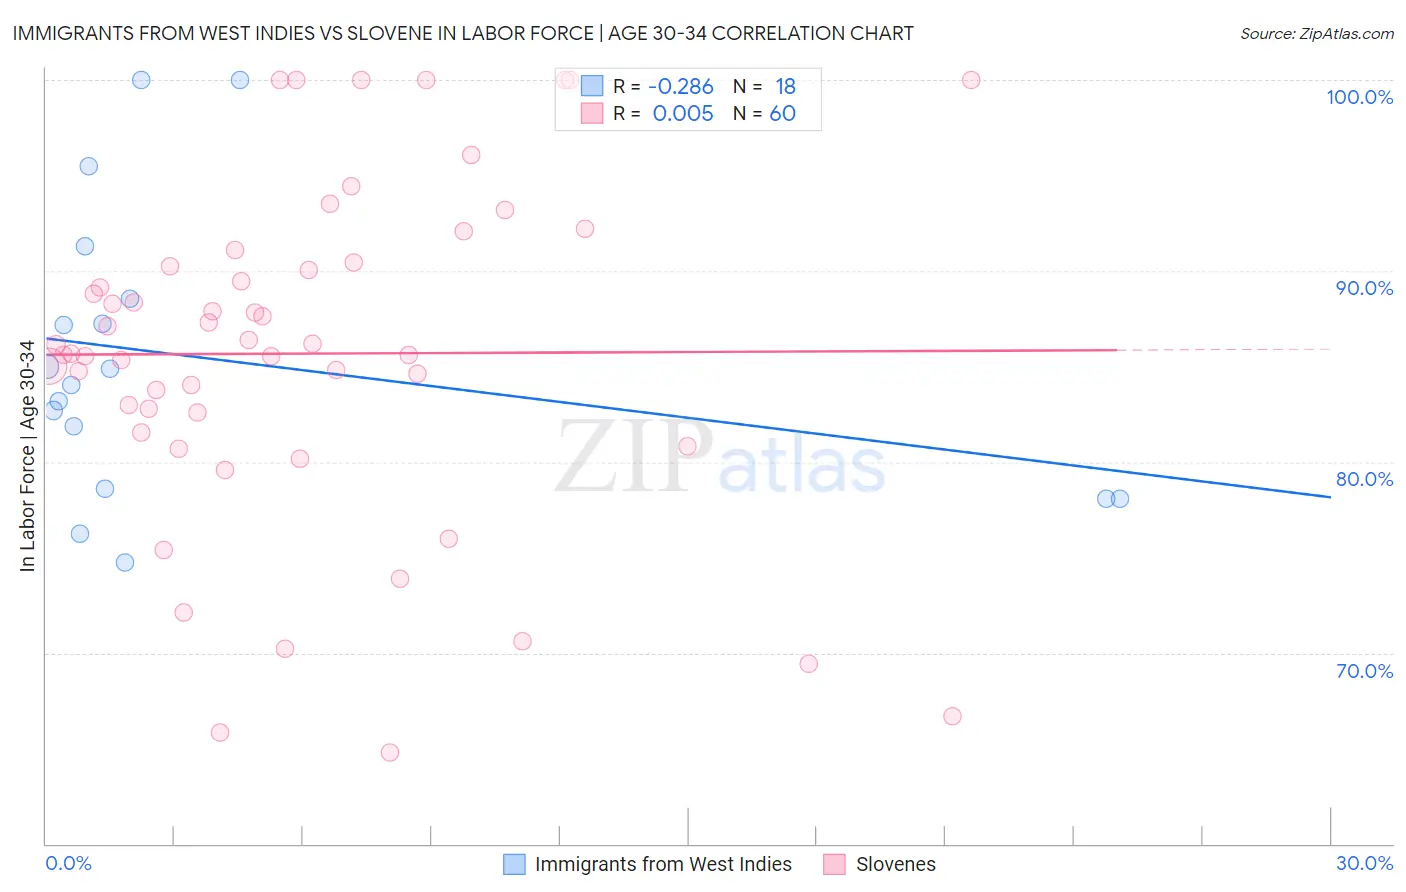
Immigrants from West Indies vs Slovene In Labor Force | Age 30-34 Correlation Chart
The statistical analysis conducted on geographies consisting of 72,450,455 people shows a weak negative correlation between the proportion of Immigrants from West Indies and labor force participation rate among population between the ages 30 and 34 in the United States with a correlation coefficient (R) of -0.286 and weighted average of 84.5%. Similarly, the statistical analysis conducted on geographies consisting of 261,230,340 people shows no correlation between the proportion of Slovenes and labor force participation rate among population between the ages 30 and 34 in the United States with a correlation coefficient (R) of 0.005 and weighted average of 85.6%, a difference of 1.3%.
In Labor Force | Age 30-34 Correlation Summary
| Measurement | Immigrants from West Indies | Slovene |
| Minimum | 74.7% | 64.8% |
| Maximum | 100.0% | 100.0% |
| Range | 25.3% | 35.2% |
| Mean | 85.4% | 85.7% |
| Median | 84.5% | 85.9% |
| Interquartile 25% (IQ1) | 78.6% | 82.1% |
| Interquartile 75% (IQ3) | 88.6% | 90.4% |
| Interquartile Range (IQR) | 10.0% | 8.3% |
| Standard Deviation (Sample) | 7.5% | 8.8% |
| Standard Deviation (Population) | 7.3% | 8.8% |
Similar Demographics by In Labor Force | Age 30-34
Demographics Similar to Immigrants from West Indies by In Labor Force | Age 30-34
In terms of in labor force | age 30-34, the demographic groups most similar to Immigrants from West Indies are Trinidadian and Tobagonian (84.5%, a difference of 0.0%), Immigrants from Thailand (84.5%, a difference of 0.010%), Subsaharan African (84.5%, a difference of 0.010%), Dutch (84.5%, a difference of 0.020%), and Canadian (84.4%, a difference of 0.030%).
| Demographics | Rating | Rank | In Labor Force | Age 30-34 |
| Koreans | 23.2 /100 | #195 | Fair 84.5% |
| British | 22.9 /100 | #196 | Fair 84.5% |
| Immigrants | Syria | 21.9 /100 | #197 | Fair 84.5% |
| Dutch | 20.2 /100 | #198 | Fair 84.5% |
| Immigrants | Thailand | 19.1 /100 | #199 | Poor 84.5% |
| Sub-Saharan Africans | 19.0 /100 | #200 | Poor 84.5% |
| Trinidadians and Tobagonians | 18.2 /100 | #201 | Poor 84.5% |
| Immigrants | West Indies | 18.1 /100 | #202 | Poor 84.5% |
| Canadians | 15.4 /100 | #203 | Poor 84.4% |
| Ecuadorians | 14.2 /100 | #204 | Poor 84.4% |
| French | 13.8 /100 | #205 | Poor 84.4% |
| Lebanese | 10.6 /100 | #206 | Poor 84.4% |
| Bangladeshis | 9.4 /100 | #207 | Tragic 84.3% |
| Arabs | 8.9 /100 | #208 | Tragic 84.3% |
| Jamaicans | 8.8 /100 | #209 | Tragic 84.3% |
Demographics Similar to Slovenes by In Labor Force | Age 30-34
In terms of in labor force | age 30-34, the demographic groups most similar to Slovenes are Cape Verdean (85.6%, a difference of 0.010%), Immigrants from Australia (85.6%, a difference of 0.030%), Immigrants from Sweden (85.6%, a difference of 0.040%), Lithuanian (85.6%, a difference of 0.040%), and Filipino (85.5%, a difference of 0.050%).
| Demographics | Rating | Rank | In Labor Force | Age 30-34 |
| Immigrants | Nepal | 99.8 /100 | #45 | Exceptional 85.6% |
| Immigrants | Morocco | 99.8 /100 | #46 | Exceptional 85.6% |
| Croatians | 99.8 /100 | #47 | Exceptional 85.6% |
| Immigrants | Sweden | 99.8 /100 | #48 | Exceptional 85.6% |
| Lithuanians | 99.8 /100 | #49 | Exceptional 85.6% |
| Immigrants | Australia | 99.8 /100 | #50 | Exceptional 85.6% |
| Cape Verdeans | 99.7 /100 | #51 | Exceptional 85.6% |
| Slovenes | 99.7 /100 | #52 | Exceptional 85.6% |
| Filipinos | 99.6 /100 | #53 | Exceptional 85.5% |
| Immigrants | Kenya | 99.6 /100 | #54 | Exceptional 85.5% |
| Immigrants | Turkey | 99.6 /100 | #55 | Exceptional 85.5% |
| Czechs | 99.6 /100 | #56 | Exceptional 85.5% |
| Russians | 99.6 /100 | #57 | Exceptional 85.5% |
| Poles | 99.6 /100 | #58 | Exceptional 85.5% |
| Immigrants | Poland | 99.5 /100 | #59 | Exceptional 85.5% |