Immigrants from West Indies vs Immigrants from Costa Rica In Labor Force | Age 30-34
COMPARE
Immigrants from West Indies
Immigrants from Costa Rica
In Labor Force | Age 30-34
In Labor Force | Age 30-34 Comparison
Immigrants from West Indies
Immigrants from Costa Rica
84.5%
IN LABOR FORCE | AGE 30-34
18.1/ 100
METRIC RATING
202nd/ 347
METRIC RANK
84.5%
IN LABOR FORCE | AGE 30-34
23.9/ 100
METRIC RATING
193rd/ 347
METRIC RANK
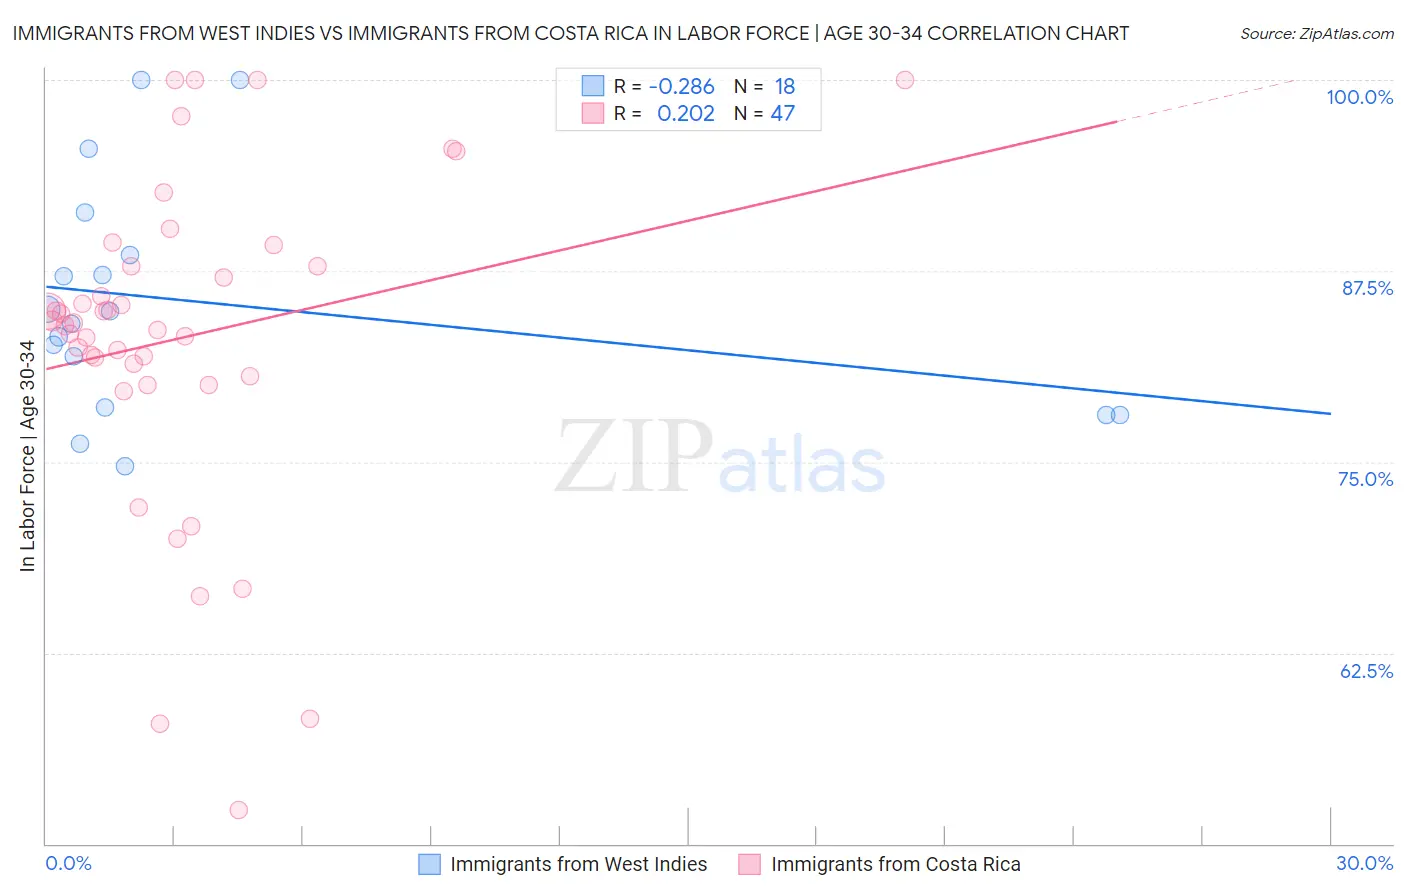
Immigrants from West Indies vs Immigrants from Costa Rica In Labor Force | Age 30-34 Correlation Chart
The statistical analysis conducted on geographies consisting of 72,450,455 people shows a weak negative correlation between the proportion of Immigrants from West Indies and labor force participation rate among population between the ages 30 and 34 in the United States with a correlation coefficient (R) of -0.286 and weighted average of 84.5%. Similarly, the statistical analysis conducted on geographies consisting of 204,236,766 people shows a weak positive correlation between the proportion of Immigrants from Costa Rica and labor force participation rate among population between the ages 30 and 34 in the United States with a correlation coefficient (R) of 0.202 and weighted average of 84.5%, a difference of 0.060%.
In Labor Force | Age 30-34 Correlation Summary
| Measurement | Immigrants from West Indies | Immigrants from Costa Rica |
| Minimum | 74.7% | 52.2% |
| Maximum | 100.0% | 100.0% |
| Range | 25.3% | 47.8% |
| Mean | 85.4% | 83.1% |
| Median | 84.5% | 84.1% |
| Interquartile 25% (IQ1) | 78.6% | 80.6% |
| Interquartile 75% (IQ3) | 88.6% | 87.8% |
| Interquartile Range (IQR) | 10.0% | 7.2% |
| Standard Deviation (Sample) | 7.5% | 10.7% |
| Standard Deviation (Population) | 7.3% | 10.5% |
Demographics Similar to Immigrants from West Indies and Immigrants from Costa Rica by In Labor Force | Age 30-34
In terms of in labor force | age 30-34, the demographic groups most similar to Immigrants from West Indies are Trinidadian and Tobagonian (84.5%, a difference of 0.0%), Immigrants from Thailand (84.5%, a difference of 0.010%), Subsaharan African (84.5%, a difference of 0.010%), Dutch (84.5%, a difference of 0.020%), and Canadian (84.4%, a difference of 0.030%). Similarly, the demographic groups most similar to Immigrants from Costa Rica are Immigrants from Afghanistan (84.5%, a difference of 0.0%), Hungarian (84.5%, a difference of 0.010%), Scandinavian (84.5%, a difference of 0.010%), Korean (84.5%, a difference of 0.010%), and British (84.5%, a difference of 0.010%).
| Demographics | Rating | Rank | In Labor Force | Age 30-34 |
| Costa Ricans | 29.6 /100 | #187 | Fair 84.6% |
| Taiwanese | 29.4 /100 | #188 | Fair 84.6% |
| Nigerians | 28.9 /100 | #189 | Fair 84.5% |
| Immigrants | Zaire | 25.8 /100 | #190 | Fair 84.5% |
| Hungarians | 24.8 /100 | #191 | Fair 84.5% |
| Scandinavians | 24.7 /100 | #192 | Fair 84.5% |
| Immigrants | Costa Rica | 23.9 /100 | #193 | Fair 84.5% |
| Immigrants | Afghanistan | 23.5 /100 | #194 | Fair 84.5% |
| Koreans | 23.2 /100 | #195 | Fair 84.5% |
| British | 22.9 /100 | #196 | Fair 84.5% |
| Immigrants | Syria | 21.9 /100 | #197 | Fair 84.5% |
| Dutch | 20.2 /100 | #198 | Fair 84.5% |
| Immigrants | Thailand | 19.1 /100 | #199 | Poor 84.5% |
| Sub-Saharan Africans | 19.0 /100 | #200 | Poor 84.5% |
| Trinidadians and Tobagonians | 18.2 /100 | #201 | Poor 84.5% |
| Immigrants | West Indies | 18.1 /100 | #202 | Poor 84.5% |
| Canadians | 15.4 /100 | #203 | Poor 84.4% |
| Ecuadorians | 14.2 /100 | #204 | Poor 84.4% |
| French | 13.8 /100 | #205 | Poor 84.4% |
| Lebanese | 10.6 /100 | #206 | Poor 84.4% |
| Bangladeshis | 9.4 /100 | #207 | Tragic 84.3% |