Immigrants from Korea vs Immigrants from Oceania In Labor Force | Age 25-29
COMPARE
Immigrants from Korea
Immigrants from Oceania
In Labor Force | Age 25-29
In Labor Force | Age 25-29 Comparison
Immigrants from Korea
Immigrants from Oceania
85.1%
IN LABOR FORCE | AGE 25-29
94.8/ 100
METRIC RATING
94th/ 347
METRIC RANK
84.2%
IN LABOR FORCE | AGE 25-29
5.0/ 100
METRIC RATING
229th/ 347
METRIC RANK
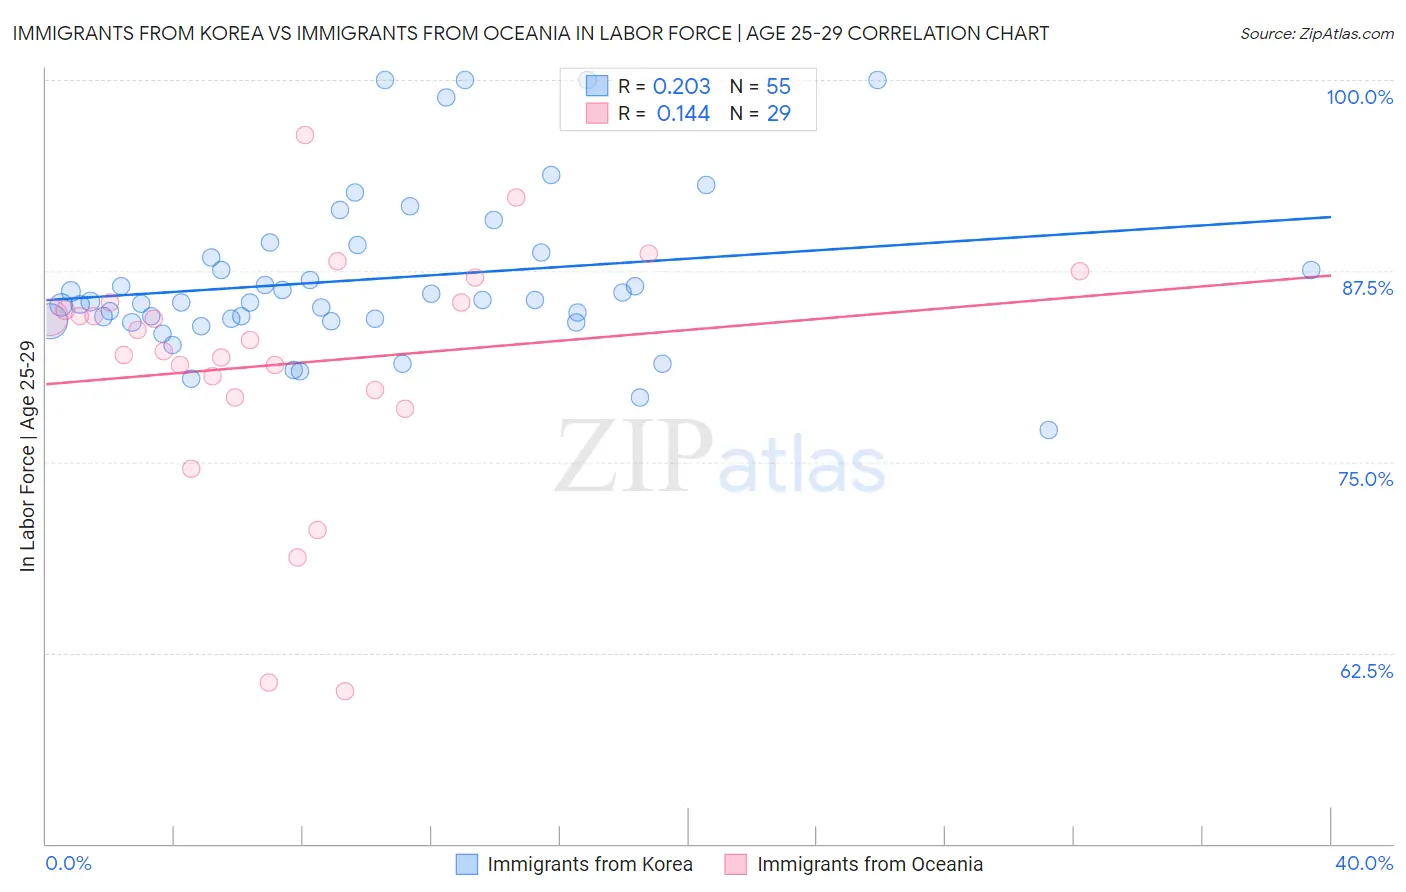
Immigrants from Korea vs Immigrants from Oceania In Labor Force | Age 25-29 Correlation Chart
The statistical analysis conducted on geographies consisting of 416,167,455 people shows a weak positive correlation between the proportion of Immigrants from Korea and labor force participation rate among population between the ages 25 and 29 in the United States with a correlation coefficient (R) of 0.203 and weighted average of 85.1%. Similarly, the statistical analysis conducted on geographies consisting of 305,432,144 people shows a poor positive correlation between the proportion of Immigrants from Oceania and labor force participation rate among population between the ages 25 and 29 in the United States with a correlation coefficient (R) of 0.144 and weighted average of 84.2%, a difference of 1.1%.
In Labor Force | Age 25-29 Correlation Summary
| Measurement | Immigrants from Korea | Immigrants from Oceania |
| Minimum | 77.1% | 60.0% |
| Maximum | 100.0% | 96.4% |
| Range | 22.9% | 36.4% |
| Mean | 87.0% | 81.4% |
| Median | 85.5% | 83.0% |
| Interquartile 25% (IQ1) | 84.2% | 79.5% |
| Interquartile 75% (IQ3) | 88.7% | 85.4% |
| Interquartile Range (IQR) | 4.5% | 6.0% |
| Standard Deviation (Sample) | 5.2% | 8.1% |
| Standard Deviation (Population) | 5.2% | 8.0% |
Similar Demographics by In Labor Force | Age 25-29
Demographics Similar to Immigrants from Korea by In Labor Force | Age 25-29
In terms of in labor force | age 25-29, the demographic groups most similar to Immigrants from Korea are Immigrants from Netherlands (85.1%, a difference of 0.010%), Immigrants from Romania (85.1%, a difference of 0.010%), Austrian (85.1%, a difference of 0.020%), Immigrants from Sudan (85.1%, a difference of 0.020%), and Immigrants from Costa Rica (85.1%, a difference of 0.030%).
| Demographics | Rating | Rank | In Labor Force | Age 25-29 |
| French Canadians | 96.5 /100 | #87 | Exceptional 85.2% |
| Immigrants | Croatia | 96.4 /100 | #88 | Exceptional 85.2% |
| Immigrants | France | 96.3 /100 | #89 | Exceptional 85.2% |
| Burmese | 95.9 /100 | #90 | Exceptional 85.1% |
| Immigrants | Moldova | 95.8 /100 | #91 | Exceptional 85.1% |
| Immigrants | Costa Rica | 95.5 /100 | #92 | Exceptional 85.1% |
| Austrians | 95.3 /100 | #93 | Exceptional 85.1% |
| Immigrants | Korea | 94.8 /100 | #94 | Exceptional 85.1% |
| Immigrants | Netherlands | 94.6 /100 | #95 | Exceptional 85.1% |
| Immigrants | Romania | 94.6 /100 | #96 | Exceptional 85.1% |
| Immigrants | Sudan | 94.3 /100 | #97 | Exceptional 85.1% |
| Mongolians | 94.1 /100 | #98 | Exceptional 85.1% |
| Bangladeshis | 94.0 /100 | #99 | Exceptional 85.1% |
| Immigrants | Switzerland | 93.9 /100 | #100 | Exceptional 85.1% |
| Egyptians | 93.8 /100 | #101 | Exceptional 85.1% |
Demographics Similar to Immigrants from Oceania by In Labor Force | Age 25-29
In terms of in labor force | age 25-29, the demographic groups most similar to Immigrants from Oceania are White/Caucasian (84.2%, a difference of 0.0%), Immigrants from Philippines (84.2%, a difference of 0.010%), French American Indian (84.2%, a difference of 0.020%), Immigrants from Panama (84.2%, a difference of 0.020%), and Panamanian (84.2%, a difference of 0.020%).
| Demographics | Rating | Rank | In Labor Force | Age 25-29 |
| Jordanians | 6.7 /100 | #222 | Tragic 84.2% |
| Scotch-Irish | 6.5 /100 | #223 | Tragic 84.2% |
| Immigrants | West Indies | 6.0 /100 | #224 | Tragic 84.2% |
| Koreans | 5.9 /100 | #225 | Tragic 84.2% |
| Immigrants | Congo | 5.8 /100 | #226 | Tragic 84.2% |
| French American Indians | 5.5 /100 | #227 | Tragic 84.2% |
| Immigrants | Panama | 5.5 /100 | #228 | Tragic 84.2% |
| Immigrants | Oceania | 5.0 /100 | #229 | Tragic 84.2% |
| Whites/Caucasians | 4.8 /100 | #230 | Tragic 84.2% |
| Immigrants | Philippines | 4.7 /100 | #231 | Tragic 84.2% |
| Panamanians | 4.5 /100 | #232 | Tragic 84.2% |
| Immigrants | Western Asia | 2.7 /100 | #233 | Tragic 84.1% |
| Barbadians | 1.0 /100 | #234 | Tragic 83.9% |
| Iraqis | 0.9 /100 | #235 | Tragic 83.9% |
| Guamanians/Chamorros | 0.9 /100 | #236 | Tragic 83.9% |