Hawaiian vs Immigrants from Oceania In Labor Force | Age 25-29
COMPARE
Hawaiian
Immigrants from Oceania
In Labor Force | Age 25-29
In Labor Force | Age 25-29 Comparison
Hawaiians
Immigrants from Oceania
83.0%
IN LABOR FORCE | AGE 25-29
0.0/ 100
METRIC RATING
291st/ 347
METRIC RANK
84.2%
IN LABOR FORCE | AGE 25-29
5.0/ 100
METRIC RATING
229th/ 347
METRIC RANK
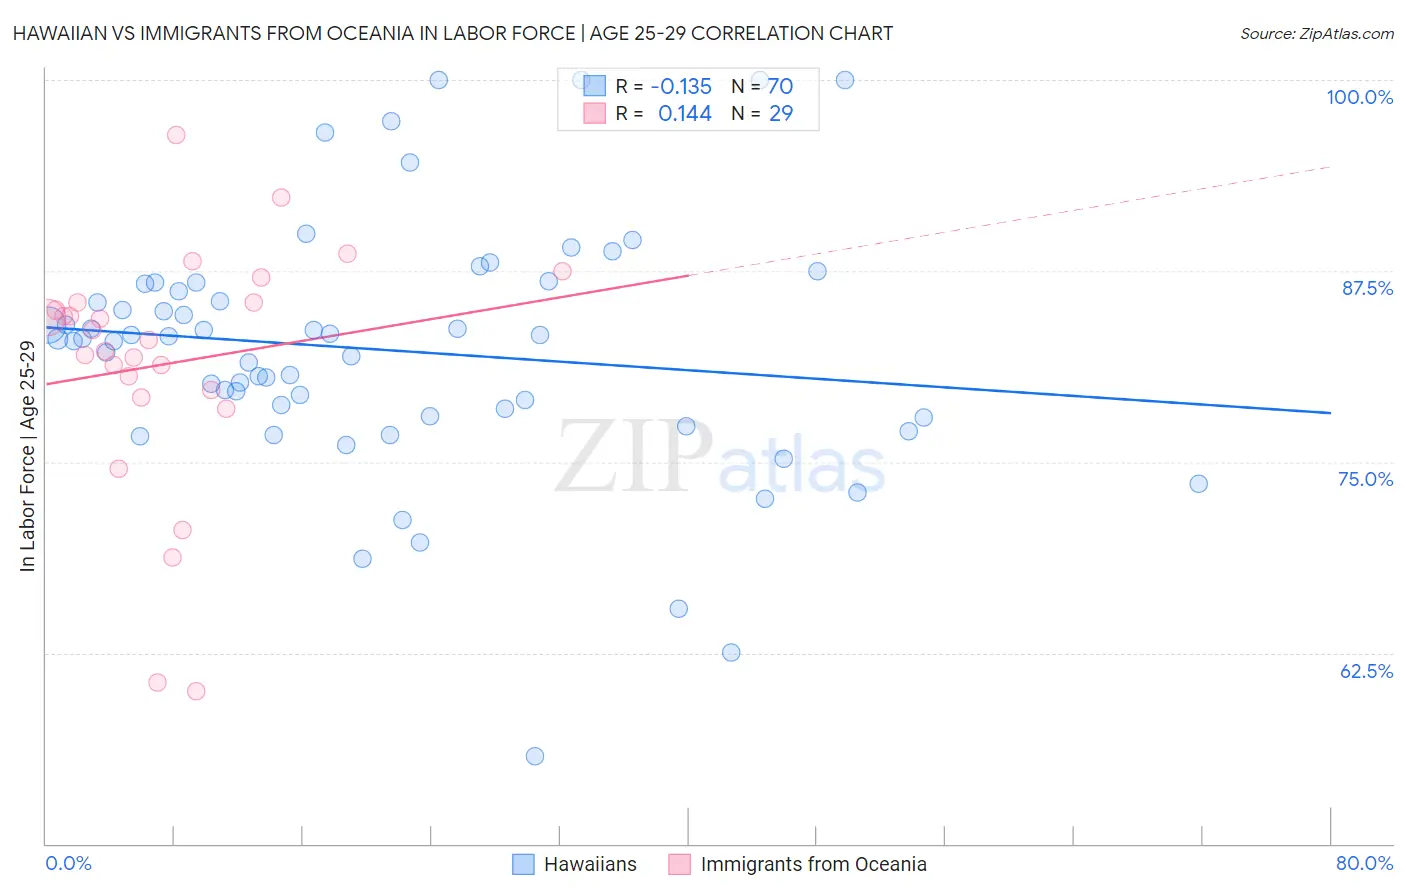
Hawaiian vs Immigrants from Oceania In Labor Force | Age 25-29 Correlation Chart
The statistical analysis conducted on geographies consisting of 327,514,664 people shows a poor negative correlation between the proportion of Hawaiians and labor force participation rate among population between the ages 25 and 29 in the United States with a correlation coefficient (R) of -0.135 and weighted average of 83.0%. Similarly, the statistical analysis conducted on geographies consisting of 305,432,144 people shows a poor positive correlation between the proportion of Immigrants from Oceania and labor force participation rate among population between the ages 25 and 29 in the United States with a correlation coefficient (R) of 0.144 and weighted average of 84.2%, a difference of 1.5%.
In Labor Force | Age 25-29 Correlation Summary
| Measurement | Hawaiian | Immigrants from Oceania |
| Minimum | 55.7% | 60.0% |
| Maximum | 100.0% | 96.4% |
| Range | 44.3% | 36.4% |
| Mean | 82.3% | 81.4% |
| Median | 83.0% | 83.0% |
| Interquartile 25% (IQ1) | 78.0% | 79.5% |
| Interquartile 75% (IQ3) | 86.7% | 85.4% |
| Interquartile Range (IQR) | 8.7% | 6.0% |
| Standard Deviation (Sample) | 8.3% | 8.1% |
| Standard Deviation (Population) | 8.2% | 8.0% |
Similar Demographics by In Labor Force | Age 25-29
Demographics Similar to Hawaiians by In Labor Force | Age 25-29
In terms of in labor force | age 25-29, the demographic groups most similar to Hawaiians are Immigrants from Bangladesh (83.0%, a difference of 0.0%), Immigrants from Guyana (83.0%, a difference of 0.020%), Immigrants from Micronesia (83.0%, a difference of 0.030%), Immigrants from Latin America (82.9%, a difference of 0.050%), and Nepalese (82.9%, a difference of 0.050%).
| Demographics | Rating | Rank | In Labor Force | Age 25-29 |
| Nicaraguans | 0.0 /100 | #284 | Tragic 83.1% |
| Belizeans | 0.0 /100 | #285 | Tragic 83.1% |
| Mexican American Indians | 0.0 /100 | #286 | Tragic 83.0% |
| Guyanese | 0.0 /100 | #287 | Tragic 83.0% |
| Ottawa | 0.0 /100 | #288 | Tragic 83.0% |
| Immigrants | Micronesia | 0.0 /100 | #289 | Tragic 83.0% |
| Immigrants | Bangladesh | 0.0 /100 | #290 | Tragic 83.0% |
| Hawaiians | 0.0 /100 | #291 | Tragic 83.0% |
| Immigrants | Guyana | 0.0 /100 | #292 | Tragic 83.0% |
| Immigrants | Latin America | 0.0 /100 | #293 | Tragic 82.9% |
| Nepalese | 0.0 /100 | #294 | Tragic 82.9% |
| Chippewa | 0.0 /100 | #295 | Tragic 82.9% |
| Immigrants | Nicaragua | 0.0 /100 | #296 | Tragic 82.9% |
| Potawatomi | 0.0 /100 | #297 | Tragic 82.9% |
| Native Hawaiians | 0.0 /100 | #298 | Tragic 82.9% |
Demographics Similar to Immigrants from Oceania by In Labor Force | Age 25-29
In terms of in labor force | age 25-29, the demographic groups most similar to Immigrants from Oceania are White/Caucasian (84.2%, a difference of 0.0%), Immigrants from Philippines (84.2%, a difference of 0.010%), French American Indian (84.2%, a difference of 0.020%), Immigrants from Panama (84.2%, a difference of 0.020%), and Panamanian (84.2%, a difference of 0.020%).
| Demographics | Rating | Rank | In Labor Force | Age 25-29 |
| Jordanians | 6.7 /100 | #222 | Tragic 84.2% |
| Scotch-Irish | 6.5 /100 | #223 | Tragic 84.2% |
| Immigrants | West Indies | 6.0 /100 | #224 | Tragic 84.2% |
| Koreans | 5.9 /100 | #225 | Tragic 84.2% |
| Immigrants | Congo | 5.8 /100 | #226 | Tragic 84.2% |
| French American Indians | 5.5 /100 | #227 | Tragic 84.2% |
| Immigrants | Panama | 5.5 /100 | #228 | Tragic 84.2% |
| Immigrants | Oceania | 5.0 /100 | #229 | Tragic 84.2% |
| Whites/Caucasians | 4.8 /100 | #230 | Tragic 84.2% |
| Immigrants | Philippines | 4.7 /100 | #231 | Tragic 84.2% |
| Panamanians | 4.5 /100 | #232 | Tragic 84.2% |
| Immigrants | Western Asia | 2.7 /100 | #233 | Tragic 84.1% |
| Barbadians | 1.0 /100 | #234 | Tragic 83.9% |
| Iraqis | 0.9 /100 | #235 | Tragic 83.9% |
| Guamanians/Chamorros | 0.9 /100 | #236 | Tragic 83.9% |