Immigrants from Uruguay vs Immigrants from Bolivia In Labor Force | Age > 16
COMPARE
Immigrants from Uruguay
Immigrants from Bolivia
In Labor Force | Age > 16
In Labor Force | Age > 16 Comparison
Immigrants from Uruguay
Immigrants from Bolivia
66.0%
IN LABOR FORCE | AGE > 16
99.1/ 100
METRIC RATING
95th/ 347
METRIC RANK
68.4%
IN LABOR FORCE | AGE > 16
100.0/ 100
METRIC RATING
10th/ 347
METRIC RANK
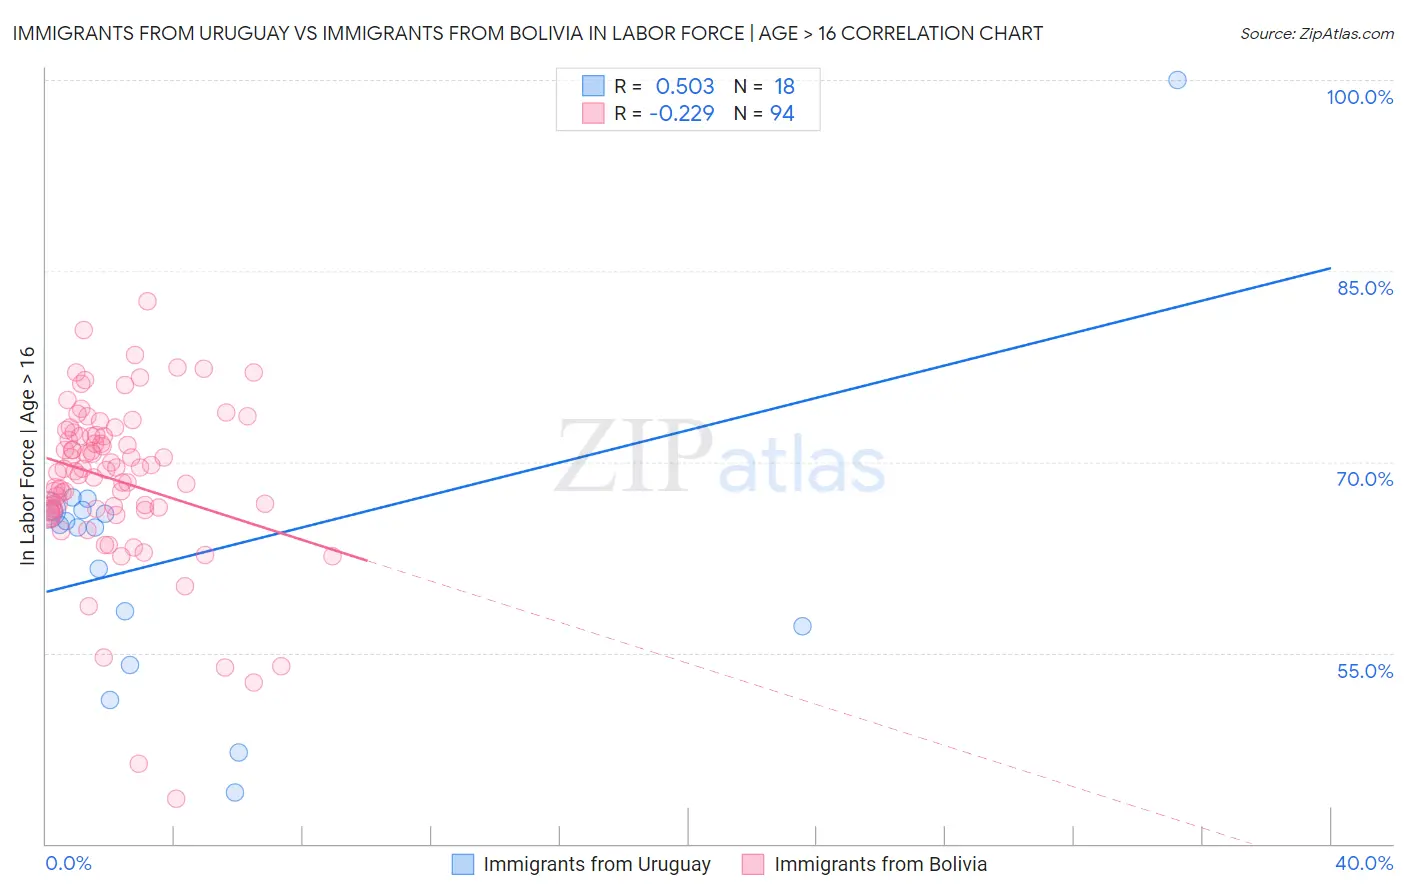
Immigrants from Uruguay vs Immigrants from Bolivia In Labor Force | Age > 16 Correlation Chart
The statistical analysis conducted on geographies consisting of 133,256,636 people shows a substantial positive correlation between the proportion of Immigrants from Uruguay and labor force participation rate among population ages 16 and over in the United States with a correlation coefficient (R) of 0.503 and weighted average of 66.0%. Similarly, the statistical analysis conducted on geographies consisting of 158,722,448 people shows a weak negative correlation between the proportion of Immigrants from Bolivia and labor force participation rate among population ages 16 and over in the United States with a correlation coefficient (R) of -0.229 and weighted average of 68.4%, a difference of 3.7%.
In Labor Force | Age > 16 Correlation Summary
| Measurement | Immigrants from Uruguay | Immigrants from Bolivia |
| Minimum | 44.0% | 43.5% |
| Maximum | 100.0% | 82.6% |
| Range | 56.0% | 39.1% |
| Mean | 62.9% | 68.6% |
| Median | 64.9% | 69.4% |
| Interquartile 25% (IQ1) | 57.1% | 66.2% |
| Interquartile 75% (IQ3) | 66.2% | 72.1% |
| Interquartile Range (IQR) | 9.1% | 5.9% |
| Standard Deviation (Sample) | 11.7% | 6.5% |
| Standard Deviation (Population) | 11.4% | 6.4% |
Similar Demographics by In Labor Force | Age > 16
Demographics Similar to Immigrants from Uruguay by In Labor Force | Age > 16
In terms of in labor force | age > 16, the demographic groups most similar to Immigrants from Uruguay are Immigrants from Cambodia (66.0%, a difference of 0.0%), Aleut (66.0%, a difference of 0.020%), Immigrants from South America (66.0%, a difference of 0.020%), Bangladeshi (65.9%, a difference of 0.040%), and Immigrants from Laos (66.0%, a difference of 0.050%).
| Demographics | Rating | Rank | In Labor Force | Age > 16 |
| Bermudans | 99.3 /100 | #88 | Exceptional 66.0% |
| Immigrants | Laos | 99.2 /100 | #89 | Exceptional 66.0% |
| Chileans | 99.2 /100 | #90 | Exceptional 66.0% |
| Iranians | 99.2 /100 | #91 | Exceptional 66.0% |
| Aleuts | 99.1 /100 | #92 | Exceptional 66.0% |
| Immigrants | South America | 99.1 /100 | #93 | Exceptional 66.0% |
| Immigrants | Cambodia | 99.1 /100 | #94 | Exceptional 66.0% |
| Immigrants | Uruguay | 99.1 /100 | #95 | Exceptional 66.0% |
| Bangladeshis | 98.9 /100 | #96 | Exceptional 65.9% |
| Filipinos | 98.9 /100 | #97 | Exceptional 65.9% |
| Immigrants | Chile | 98.7 /100 | #98 | Exceptional 65.9% |
| Immigrants | Australia | 98.7 /100 | #99 | Exceptional 65.9% |
| Okinawans | 98.7 /100 | #100 | Exceptional 65.9% |
| Immigrants | Colombia | 98.6 /100 | #101 | Exceptional 65.9% |
| Uruguayans | 98.6 /100 | #102 | Exceptional 65.9% |
Demographics Similar to Immigrants from Bolivia by In Labor Force | Age > 16
In terms of in labor force | age > 16, the demographic groups most similar to Immigrants from Bolivia are Immigrants from Eastern Africa (68.5%, a difference of 0.030%), Immigrants from Sierra Leone (68.5%, a difference of 0.050%), Immigrants from Cameroon (68.7%, a difference of 0.36%), Bolivian (68.2%, a difference of 0.37%), and Sudanese (68.0%, a difference of 0.59%).
| Demographics | Rating | Rank | In Labor Force | Age > 16 |
| Somalis | 100.0 /100 | #3 | Exceptional 69.2% |
| Immigrants | Somalia | 100.0 /100 | #4 | Exceptional 69.1% |
| Sierra Leoneans | 100.0 /100 | #5 | Exceptional 68.9% |
| Immigrants | Eritrea | 100.0 /100 | #6 | Exceptional 68.9% |
| Immigrants | Cameroon | 100.0 /100 | #7 | Exceptional 68.7% |
| Immigrants | Sierra Leone | 100.0 /100 | #8 | Exceptional 68.5% |
| Immigrants | Eastern Africa | 100.0 /100 | #9 | Exceptional 68.5% |
| Immigrants | Bolivia | 100.0 /100 | #10 | Exceptional 68.4% |
| Bolivians | 100.0 /100 | #11 | Exceptional 68.2% |
| Sudanese | 100.0 /100 | #12 | Exceptional 68.0% |
| Immigrants | Nepal | 100.0 /100 | #13 | Exceptional 68.0% |
| Liberians | 100.0 /100 | #14 | Exceptional 67.8% |
| Immigrants | Middle Africa | 100.0 /100 | #15 | Exceptional 67.7% |
| Immigrants | Sudan | 100.0 /100 | #16 | Exceptional 67.7% |
| Immigrants | India | 100.0 /100 | #17 | Exceptional 67.6% |