Immigrants from Uruguay vs Immigrants from Kuwait In Labor Force | Age > 16
COMPARE
Immigrants from Uruguay
Immigrants from Kuwait
In Labor Force | Age > 16
In Labor Force | Age > 16 Comparison
Immigrants from Uruguay
Immigrants from Kuwait
66.0%
IN LABOR FORCE | AGE > 16
99.1/ 100
METRIC RATING
95th/ 347
METRIC RANK
66.5%
IN LABOR FORCE | AGE > 16
100.0/ 100
METRIC RATING
51st/ 347
METRIC RANK
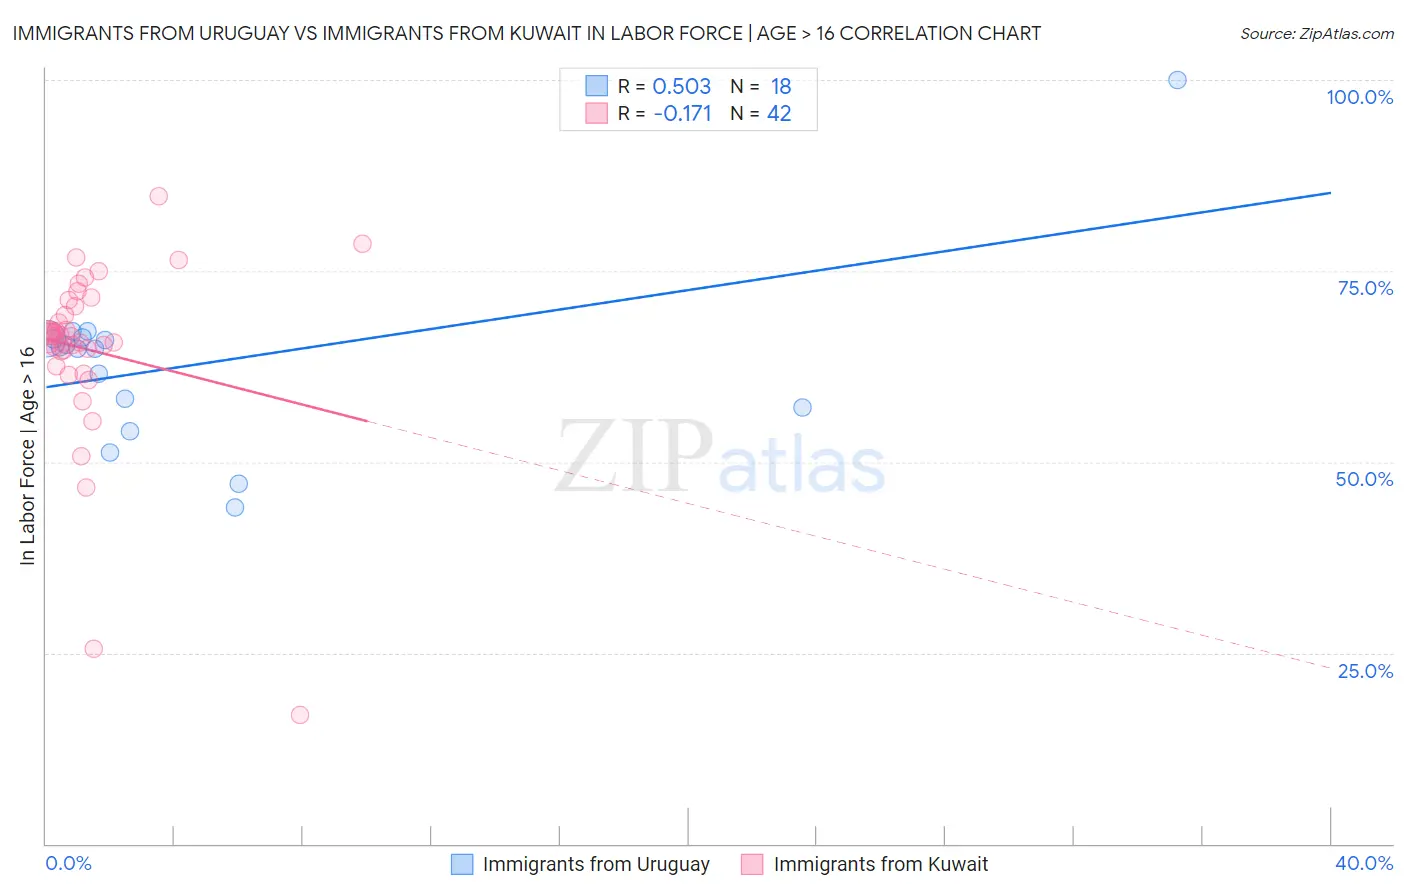
Immigrants from Uruguay vs Immigrants from Kuwait In Labor Force | Age > 16 Correlation Chart
The statistical analysis conducted on geographies consisting of 133,256,636 people shows a substantial positive correlation between the proportion of Immigrants from Uruguay and labor force participation rate among population ages 16 and over in the United States with a correlation coefficient (R) of 0.503 and weighted average of 66.0%. Similarly, the statistical analysis conducted on geographies consisting of 136,916,630 people shows a poor negative correlation between the proportion of Immigrants from Kuwait and labor force participation rate among population ages 16 and over in the United States with a correlation coefficient (R) of -0.171 and weighted average of 66.5%, a difference of 0.83%.
In Labor Force | Age > 16 Correlation Summary
| Measurement | Immigrants from Uruguay | Immigrants from Kuwait |
| Minimum | 44.0% | 16.8% |
| Maximum | 100.0% | 84.7% |
| Range | 56.0% | 67.9% |
| Mean | 62.9% | 64.6% |
| Median | 64.9% | 66.5% |
| Interquartile 25% (IQ1) | 57.1% | 64.5% |
| Interquartile 75% (IQ3) | 66.2% | 70.4% |
| Interquartile Range (IQR) | 9.1% | 5.9% |
| Standard Deviation (Sample) | 11.7% | 12.0% |
| Standard Deviation (Population) | 11.4% | 11.9% |
Similar Demographics by In Labor Force | Age > 16
Demographics Similar to Immigrants from Uruguay by In Labor Force | Age > 16
In terms of in labor force | age > 16, the demographic groups most similar to Immigrants from Uruguay are Immigrants from Cambodia (66.0%, a difference of 0.0%), Aleut (66.0%, a difference of 0.020%), Immigrants from South America (66.0%, a difference of 0.020%), Bangladeshi (65.9%, a difference of 0.040%), and Immigrants from Laos (66.0%, a difference of 0.050%).
| Demographics | Rating | Rank | In Labor Force | Age > 16 |
| Bermudans | 99.3 /100 | #88 | Exceptional 66.0% |
| Immigrants | Laos | 99.2 /100 | #89 | Exceptional 66.0% |
| Chileans | 99.2 /100 | #90 | Exceptional 66.0% |
| Iranians | 99.2 /100 | #91 | Exceptional 66.0% |
| Aleuts | 99.1 /100 | #92 | Exceptional 66.0% |
| Immigrants | South America | 99.1 /100 | #93 | Exceptional 66.0% |
| Immigrants | Cambodia | 99.1 /100 | #94 | Exceptional 66.0% |
| Immigrants | Uruguay | 99.1 /100 | #95 | Exceptional 66.0% |
| Bangladeshis | 98.9 /100 | #96 | Exceptional 65.9% |
| Filipinos | 98.9 /100 | #97 | Exceptional 65.9% |
| Immigrants | Chile | 98.7 /100 | #98 | Exceptional 65.9% |
| Immigrants | Australia | 98.7 /100 | #99 | Exceptional 65.9% |
| Okinawans | 98.7 /100 | #100 | Exceptional 65.9% |
| Immigrants | Colombia | 98.6 /100 | #101 | Exceptional 65.9% |
| Uruguayans | 98.6 /100 | #102 | Exceptional 65.9% |
Demographics Similar to Immigrants from Kuwait by In Labor Force | Age > 16
In terms of in labor force | age > 16, the demographic groups most similar to Immigrants from Kuwait are Paraguayan (66.5%, a difference of 0.030%), Immigrants from Sri Lanka (66.5%, a difference of 0.050%), Cape Verdean (66.6%, a difference of 0.070%), Immigrants from Bosnia and Herzegovina (66.5%, a difference of 0.080%), and Immigrants from Northern Africa (66.6%, a difference of 0.12%).
| Demographics | Rating | Rank | In Labor Force | Age > 16 |
| Immigrants | Pakistan | 100.0 /100 | #44 | Exceptional 66.7% |
| Immigrants | Brazil | 100.0 /100 | #45 | Exceptional 66.7% |
| Brazilians | 100.0 /100 | #46 | Exceptional 66.6% |
| Immigrants | Bulgaria | 100.0 /100 | #47 | Exceptional 66.6% |
| Nigerians | 100.0 /100 | #48 | Exceptional 66.6% |
| Immigrants | Northern Africa | 100.0 /100 | #49 | Exceptional 66.6% |
| Cape Verdeans | 100.0 /100 | #50 | Exceptional 66.6% |
| Immigrants | Kuwait | 100.0 /100 | #51 | Exceptional 66.5% |
| Paraguayans | 99.9 /100 | #52 | Exceptional 66.5% |
| Immigrants | Sri Lanka | 99.9 /100 | #53 | Exceptional 66.5% |
| Immigrants | Bosnia and Herzegovina | 99.9 /100 | #54 | Exceptional 66.5% |
| Immigrants | Venezuela | 99.9 /100 | #55 | Exceptional 66.4% |
| Immigrants | Senegal | 99.9 /100 | #56 | Exceptional 66.4% |
| Bulgarians | 99.9 /100 | #57 | Exceptional 66.4% |
| Immigrants | Saudi Arabia | 99.9 /100 | #58 | Exceptional 66.3% |