Immigrants from Uruguay vs Immigrants from Bolivia Unemployment Among Ages 60 to 64 years
COMPARE
Immigrants from Uruguay
Immigrants from Bolivia
Unemployment Among Ages 60 to 64 years
Unemployment Among Ages 60 to 64 years Comparison
Immigrants from Uruguay
Immigrants from Bolivia
5.1%
UNEMPLOYMENT AMONG AGES 60 TO 64 YEARS
0.9/ 100
METRIC RATING
251st/ 347
METRIC RANK
4.8%
UNEMPLOYMENT AMONG AGES 60 TO 64 YEARS
69.2/ 100
METRIC RATING
156th/ 347
METRIC RANK
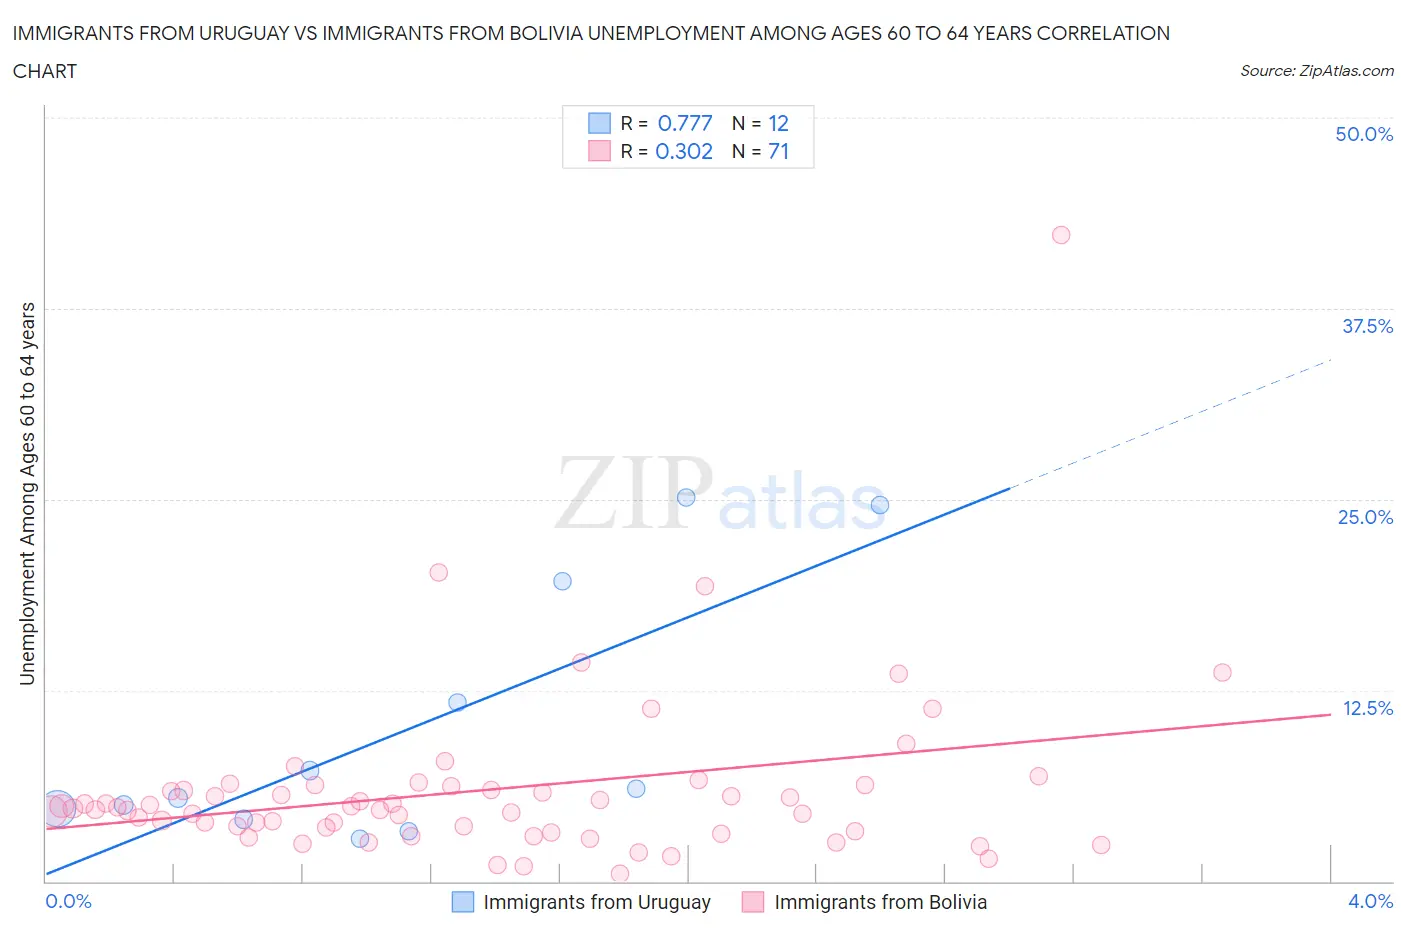
Immigrants from Uruguay vs Immigrants from Bolivia Unemployment Among Ages 60 to 64 years Correlation Chart
The statistical analysis conducted on geographies consisting of 129,229,994 people shows a strong positive correlation between the proportion of Immigrants from Uruguay and unemployment rate among population between the ages 60 and 64 in the United States with a correlation coefficient (R) of 0.777 and weighted average of 5.1%. Similarly, the statistical analysis conducted on geographies consisting of 152,984,094 people shows a mild positive correlation between the proportion of Immigrants from Bolivia and unemployment rate among population between the ages 60 and 64 in the United States with a correlation coefficient (R) of 0.302 and weighted average of 4.8%, a difference of 4.9%.
Unemployment Among Ages 60 to 64 years Correlation Summary
| Measurement | Immigrants from Uruguay | Immigrants from Bolivia |
| Minimum | 2.8% | 0.50% |
| Maximum | 25.1% | 42.3% |
| Range | 22.4% | 41.8% |
| Mean | 10.0% | 6.0% |
| Median | 5.7% | 4.7% |
| Interquartile 25% (IQ1) | 4.4% | 3.3% |
| Interquartile 75% (IQ3) | 15.7% | 6.2% |
| Interquartile Range (IQR) | 11.3% | 2.9% |
| Standard Deviation (Sample) | 8.3% | 5.7% |
| Standard Deviation (Population) | 8.0% | 5.7% |
Similar Demographics by Unemployment Among Ages 60 to 64 years
Demographics Similar to Immigrants from Uruguay by Unemployment Among Ages 60 to 64 years
In terms of unemployment among ages 60 to 64 years, the demographic groups most similar to Immigrants from Uruguay are Immigrants from Switzerland (5.1%, a difference of 0.010%), Immigrants from Cambodia (5.1%, a difference of 0.030%), Immigrants from China (5.1%, a difference of 0.050%), Costa Rican (5.1%, a difference of 0.080%), and Estonian (5.1%, a difference of 0.090%).
| Demographics | Rating | Rank | Unemployment Among Ages 60 to 64 years |
| Peruvians | 1.6 /100 | #244 | Tragic 5.0% |
| Comanche | 1.3 /100 | #245 | Tragic 5.0% |
| Immigrants | South America | 1.1 /100 | #246 | Tragic 5.0% |
| Immigrants | North Macedonia | 1.1 /100 | #247 | Tragic 5.0% |
| Immigrants | Fiji | 1.1 /100 | #248 | Tragic 5.1% |
| South Americans | 1.0 /100 | #249 | Tragic 5.1% |
| Immigrants | Cambodia | 0.9 /100 | #250 | Tragic 5.1% |
| Immigrants | Uruguay | 0.9 /100 | #251 | Tragic 5.1% |
| Immigrants | Switzerland | 0.9 /100 | #252 | Tragic 5.1% |
| Immigrants | China | 0.9 /100 | #253 | Tragic 5.1% |
| Costa Ricans | 0.8 /100 | #254 | Tragic 5.1% |
| Estonians | 0.8 /100 | #255 | Tragic 5.1% |
| Immigrants | Peru | 0.7 /100 | #256 | Tragic 5.1% |
| Japanese | 0.6 /100 | #257 | Tragic 5.1% |
| Celtics | 0.5 /100 | #258 | Tragic 5.1% |
Demographics Similar to Immigrants from Bolivia by Unemployment Among Ages 60 to 64 years
In terms of unemployment among ages 60 to 64 years, the demographic groups most similar to Immigrants from Bolivia are Laotian (4.8%, a difference of 0.090%), Filipino (4.8%, a difference of 0.13%), Immigrants from Taiwan (4.8%, a difference of 0.13%), Chilean (4.8%, a difference of 0.15%), and Spanish (4.8%, a difference of 0.15%).
| Demographics | Rating | Rank | Unemployment Among Ages 60 to 64 years |
| Arabs | 78.8 /100 | #149 | Good 4.8% |
| Immigrants | Italy | 78.7 /100 | #150 | Good 4.8% |
| Immigrants | South Africa | 78.5 /100 | #151 | Good 4.8% |
| Americans | 75.7 /100 | #152 | Good 4.8% |
| Bolivians | 75.5 /100 | #153 | Good 4.8% |
| Chileans | 72.6 /100 | #154 | Good 4.8% |
| Filipinos | 72.1 /100 | #155 | Good 4.8% |
| Immigrants | Bolivia | 69.2 /100 | #156 | Good 4.8% |
| Laotians | 66.8 /100 | #157 | Good 4.8% |
| Immigrants | Taiwan | 66.0 /100 | #158 | Good 4.8% |
| Spanish | 65.5 /100 | #159 | Good 4.8% |
| Australians | 65.3 /100 | #160 | Good 4.8% |
| Immigrants | Norway | 65.1 /100 | #161 | Good 4.8% |
| South Africans | 65.1 /100 | #162 | Good 4.8% |
| Immigrants | Belgium | 64.8 /100 | #163 | Good 4.8% |