Immigrants from Uganda vs Immigrants from Brazil In Labor Force | Age 20-24
COMPARE
Immigrants from Uganda
Immigrants from Brazil
In Labor Force | Age 20-24
In Labor Force | Age 20-24 Comparison
Immigrants from Uganda
Immigrants from Brazil
76.0%
IN LABOR FORCE | AGE 20-24
97.1/ 100
METRIC RATING
106th/ 347
METRIC RANK
75.5%
IN LABOR FORCE | AGE 20-24
84.8/ 100
METRIC RATING
136th/ 347
METRIC RANK
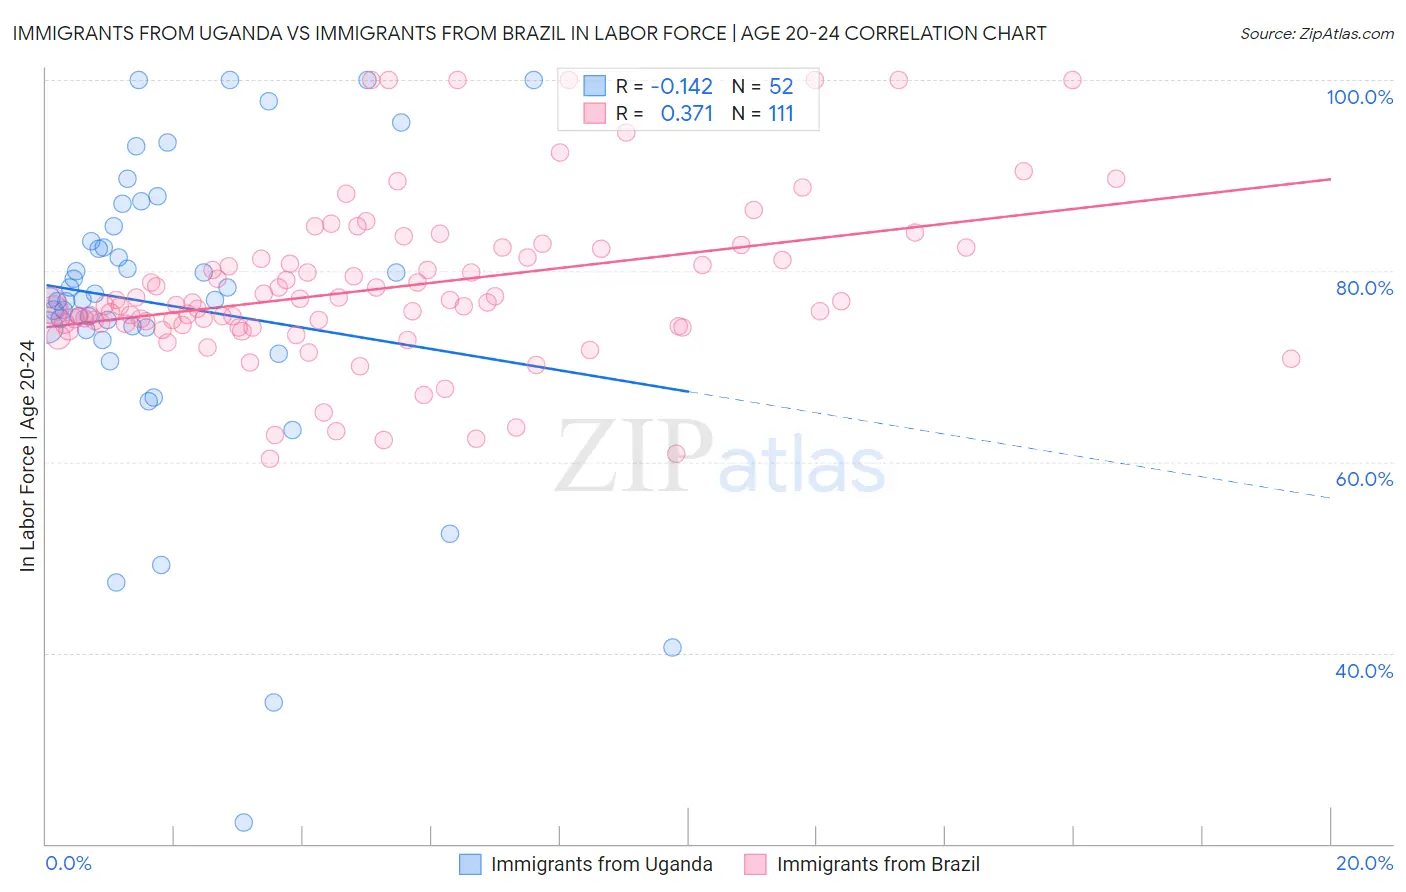
Immigrants from Uganda vs Immigrants from Brazil In Labor Force | Age 20-24 Correlation Chart
The statistical analysis conducted on geographies consisting of 125,978,128 people shows a poor negative correlation between the proportion of Immigrants from Uganda and labor force participation rate among population between the ages 20 and 24 in the United States with a correlation coefficient (R) of -0.142 and weighted average of 76.0%. Similarly, the statistical analysis conducted on geographies consisting of 342,949,141 people shows a mild positive correlation between the proportion of Immigrants from Brazil and labor force participation rate among population between the ages 20 and 24 in the United States with a correlation coefficient (R) of 0.371 and weighted average of 75.5%, a difference of 0.65%.
In Labor Force | Age 20-24 Correlation Summary
| Measurement | Immigrants from Uganda | Immigrants from Brazil |
| Minimum | 22.2% | 60.3% |
| Maximum | 100.0% | 100.0% |
| Range | 77.8% | 39.7% |
| Mean | 76.3% | 78.2% |
| Median | 77.1% | 76.4% |
| Interquartile 25% (IQ1) | 73.9% | 74.2% |
| Interquartile 75% (IQ3) | 83.9% | 81.3% |
| Interquartile Range (IQR) | 10.0% | 7.1% |
| Standard Deviation (Sample) | 16.0% | 8.5% |
| Standard Deviation (Population) | 15.8% | 8.5% |
Similar Demographics by In Labor Force | Age 20-24
Demographics Similar to Immigrants from Uganda by In Labor Force | Age 20-24
In terms of in labor force | age 20-24, the demographic groups most similar to Immigrants from Uganda are Immigrants from Nepal (76.0%, a difference of 0.010%), Macedonian (76.0%, a difference of 0.020%), Greek (76.0%, a difference of 0.030%), Immigrants from North Macedonia (76.1%, a difference of 0.060%), and Iraqi (76.0%, a difference of 0.060%).
| Demographics | Rating | Rank | In Labor Force | Age 20-24 |
| Americans | 97.8 /100 | #99 | Exceptional 76.1% |
| Shoshone | 97.8 /100 | #100 | Exceptional 76.1% |
| Immigrants | Poland | 97.7 /100 | #101 | Exceptional 76.1% |
| Latvians | 97.6 /100 | #102 | Exceptional 76.1% |
| Immigrants | North Macedonia | 97.5 /100 | #103 | Exceptional 76.1% |
| Macedonians | 97.2 /100 | #104 | Exceptional 76.0% |
| Immigrants | Nepal | 97.2 /100 | #105 | Exceptional 76.0% |
| Immigrants | Uganda | 97.1 /100 | #106 | Exceptional 76.0% |
| Greeks | 96.9 /100 | #107 | Exceptional 76.0% |
| Iraqis | 96.6 /100 | #108 | Exceptional 76.0% |
| Cherokee | 95.8 /100 | #109 | Exceptional 75.9% |
| Immigrants | Morocco | 95.8 /100 | #110 | Exceptional 75.9% |
| Ukrainians | 95.7 /100 | #111 | Exceptional 75.9% |
| Immigrants | Canada | 95.6 /100 | #112 | Exceptional 75.9% |
| Immigrants | Netherlands | 95.3 /100 | #113 | Exceptional 75.9% |
Demographics Similar to Immigrants from Brazil by In Labor Force | Age 20-24
In terms of in labor force | age 20-24, the demographic groups most similar to Immigrants from Brazil are Jordanian (75.5%, a difference of 0.0%), Australian (75.5%, a difference of 0.0%), Immigrants from England (75.5%, a difference of 0.010%), Delaware (75.5%, a difference of 0.010%), and Yaqui (75.5%, a difference of 0.020%).
| Demographics | Rating | Rank | In Labor Force | Age 20-24 |
| Iroquois | 89.1 /100 | #129 | Excellent 75.6% |
| Immigrants | Austria | 88.8 /100 | #130 | Excellent 75.6% |
| Immigrants | Jordan | 88.5 /100 | #131 | Excellent 75.6% |
| Palestinians | 88.4 /100 | #132 | Excellent 75.6% |
| Zimbabweans | 88.2 /100 | #133 | Excellent 75.6% |
| Estonians | 87.1 /100 | #134 | Excellent 75.6% |
| Yaqui | 85.5 /100 | #135 | Excellent 75.5% |
| Immigrants | Brazil | 84.8 /100 | #136 | Excellent 75.5% |
| Jordanians | 84.8 /100 | #137 | Excellent 75.5% |
| Australians | 84.8 /100 | #138 | Excellent 75.5% |
| Immigrants | England | 84.6 /100 | #139 | Excellent 75.5% |
| Delaware | 84.5 /100 | #140 | Excellent 75.5% |
| Romanians | 84.1 /100 | #141 | Excellent 75.5% |
| Blackfeet | 83.6 /100 | #142 | Excellent 75.5% |
| Spaniards | 82.0 /100 | #143 | Excellent 75.5% |