Greek vs Immigrants from Micronesia In Labor Force | Age 45-54
COMPARE
Greek
Immigrants from Micronesia
In Labor Force | Age 45-54
In Labor Force | Age 45-54 Comparison
Greeks
Immigrants from Micronesia
83.3%
IN LABOR FORCE | AGE 45-54
95.9/ 100
METRIC RATING
85th/ 347
METRIC RANK
81.1%
IN LABOR FORCE | AGE 45-54
0.0/ 100
METRIC RATING
279th/ 347
METRIC RANK
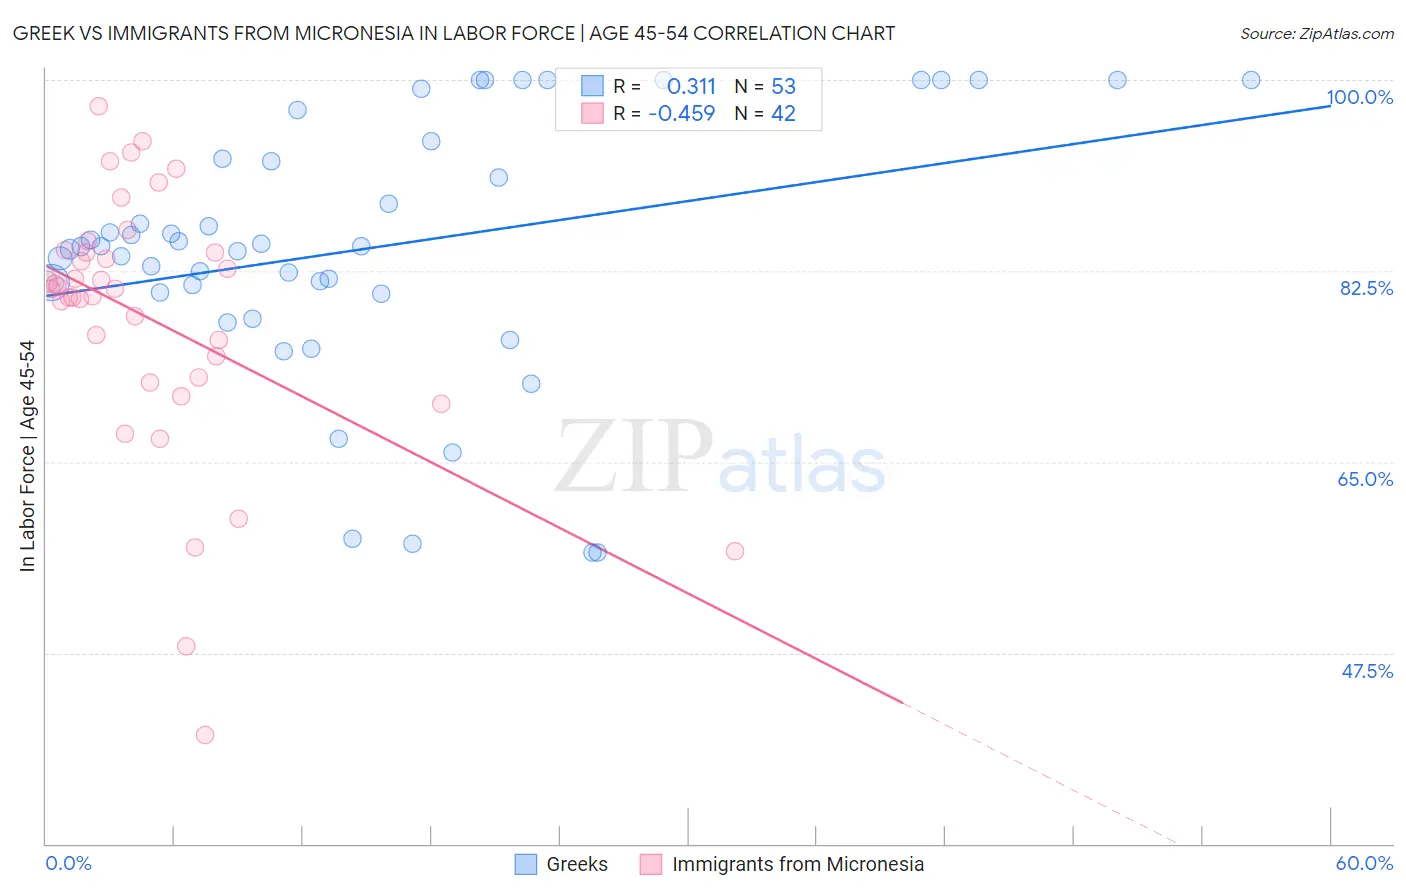
Greek vs Immigrants from Micronesia In Labor Force | Age 45-54 Correlation Chart
The statistical analysis conducted on geographies consisting of 482,326,237 people shows a mild positive correlation between the proportion of Greeks and labor force participation rate among population between the ages 45 and 54 in the United States with a correlation coefficient (R) of 0.311 and weighted average of 83.3%. Similarly, the statistical analysis conducted on geographies consisting of 61,599,653 people shows a moderate negative correlation between the proportion of Immigrants from Micronesia and labor force participation rate among population between the ages 45 and 54 in the United States with a correlation coefficient (R) of -0.459 and weighted average of 81.1%, a difference of 2.8%.
In Labor Force | Age 45-54 Correlation Summary
| Measurement | Greek | Immigrants from Micronesia |
| Minimum | 56.7% | 40.0% |
| Maximum | 100.0% | 97.6% |
| Range | 43.3% | 57.6% |
| Mean | 84.6% | 78.1% |
| Median | 84.8% | 80.8% |
| Interquartile 25% (IQ1) | 80.5% | 72.7% |
| Interquartile 75% (IQ3) | 93.6% | 84.2% |
| Interquartile Range (IQR) | 13.1% | 11.5% |
| Standard Deviation (Sample) | 11.8% | 12.1% |
| Standard Deviation (Population) | 11.7% | 11.9% |
Similar Demographics by In Labor Force | Age 45-54
Demographics Similar to Greeks by In Labor Force | Age 45-54
In terms of in labor force | age 45-54, the demographic groups most similar to Greeks are Immigrants from Bosnia and Herzegovina (83.3%, a difference of 0.010%), Immigrants from Northern Africa (83.3%, a difference of 0.010%), Immigrants from Eastern Asia (83.4%, a difference of 0.020%), Immigrants from Zimbabwe (83.4%, a difference of 0.020%), and Immigrants from Eastern Europe (83.3%, a difference of 0.020%).
| Demographics | Rating | Rank | In Labor Force | Age 45-54 |
| Immigrants | Egypt | 96.6 /100 | #78 | Exceptional 83.4% |
| Belgians | 96.5 /100 | #79 | Exceptional 83.4% |
| Immigrants | Croatia | 96.5 /100 | #80 | Exceptional 83.4% |
| Jordanians | 96.4 /100 | #81 | Exceptional 83.4% |
| Immigrants | Eastern Asia | 96.3 /100 | #82 | Exceptional 83.4% |
| Immigrants | Zimbabwe | 96.3 /100 | #83 | Exceptional 83.4% |
| Immigrants | Bosnia and Herzegovina | 96.0 /100 | #84 | Exceptional 83.3% |
| Greeks | 95.9 /100 | #85 | Exceptional 83.3% |
| Immigrants | Northern Africa | 95.7 /100 | #86 | Exceptional 83.3% |
| Immigrants | Eastern Europe | 95.6 /100 | #87 | Exceptional 83.3% |
| Immigrants | Asia | 95.6 /100 | #88 | Exceptional 83.3% |
| Indians (Asian) | 95.5 /100 | #89 | Exceptional 83.3% |
| Immigrants | Japan | 95.5 /100 | #90 | Exceptional 83.3% |
| South Americans | 95.5 /100 | #91 | Exceptional 83.3% |
| Danes | 95.3 /100 | #92 | Exceptional 83.3% |
Demographics Similar to Immigrants from Micronesia by In Labor Force | Age 45-54
In terms of in labor force | age 45-54, the demographic groups most similar to Immigrants from Micronesia are Immigrants from Guatemala (81.1%, a difference of 0.010%), Guatemalan (81.2%, a difference of 0.090%), U.S. Virgin Islander (81.2%, a difference of 0.11%), Immigrants from Latin America (81.0%, a difference of 0.11%), and Immigrants from Grenada (81.0%, a difference of 0.11%).
| Demographics | Rating | Rank | In Labor Force | Age 45-54 |
| Spanish | 0.0 /100 | #272 | Tragic 81.3% |
| Chippewa | 0.0 /100 | #273 | Tragic 81.3% |
| British West Indians | 0.0 /100 | #274 | Tragic 81.2% |
| Immigrants | Nonimmigrants | 0.0 /100 | #275 | Tragic 81.2% |
| U.S. Virgin Islanders | 0.0 /100 | #276 | Tragic 81.2% |
| Guatemalans | 0.0 /100 | #277 | Tragic 81.2% |
| Immigrants | Guatemala | 0.0 /100 | #278 | Tragic 81.1% |
| Immigrants | Micronesia | 0.0 /100 | #279 | Tragic 81.1% |
| Immigrants | Latin America | 0.0 /100 | #280 | Tragic 81.0% |
| Immigrants | Grenada | 0.0 /100 | #281 | Tragic 81.0% |
| Aleuts | 0.0 /100 | #282 | Tragic 81.0% |
| French American Indians | 0.0 /100 | #283 | Tragic 80.8% |
| Belizeans | 0.0 /100 | #284 | Tragic 80.8% |
| Delaware | 0.0 /100 | #285 | Tragic 80.8% |
| Immigrants | Dominica | 0.0 /100 | #286 | Tragic 80.8% |