Immigrants from Nepal vs Choctaw In Labor Force | Age 25-29
COMPARE
Immigrants from Nepal
Choctaw
In Labor Force | Age 25-29
In Labor Force | Age 25-29 Comparison
Immigrants from Nepal
Choctaw
85.8%
IN LABOR FORCE | AGE 25-29
99.9/ 100
METRIC RATING
36th/ 347
METRIC RANK
81.0%
IN LABOR FORCE | AGE 25-29
0.0/ 100
METRIC RATING
326th/ 347
METRIC RANK
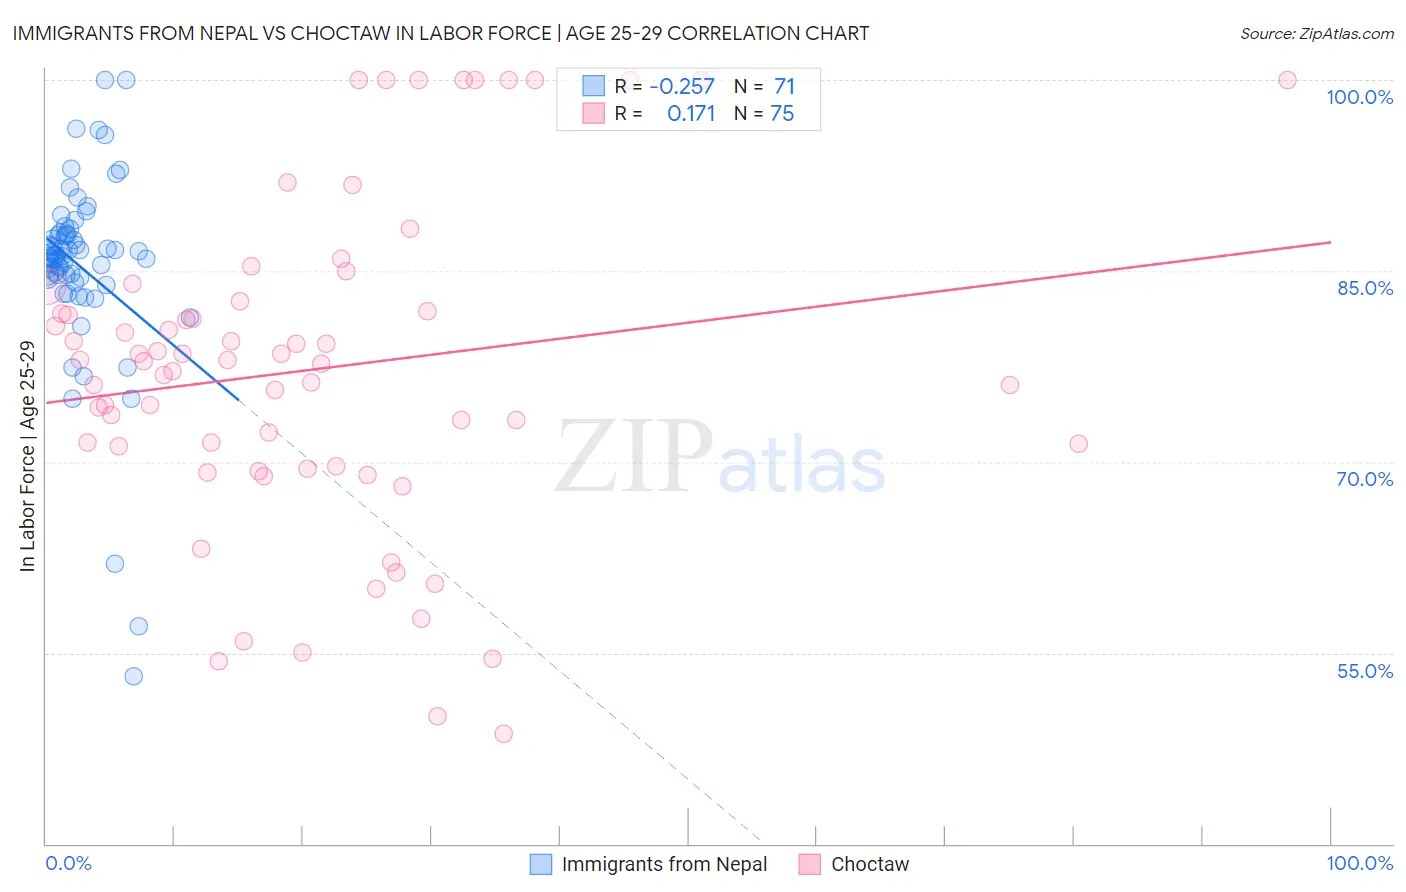
Immigrants from Nepal vs Choctaw In Labor Force | Age 25-29 Correlation Chart
The statistical analysis conducted on geographies consisting of 186,763,083 people shows a weak negative correlation between the proportion of Immigrants from Nepal and labor force participation rate among population between the ages 25 and 29 in the United States with a correlation coefficient (R) of -0.257 and weighted average of 85.8%. Similarly, the statistical analysis conducted on geographies consisting of 269,623,280 people shows a poor positive correlation between the proportion of Choctaw and labor force participation rate among population between the ages 25 and 29 in the United States with a correlation coefficient (R) of 0.171 and weighted average of 81.0%, a difference of 6.0%.
In Labor Force | Age 25-29 Correlation Summary
| Measurement | Immigrants from Nepal | Choctaw |
| Minimum | 53.2% | 48.6% |
| Maximum | 100.0% | 100.0% |
| Range | 46.8% | 51.4% |
| Mean | 85.3% | 77.3% |
| Median | 86.2% | 77.9% |
| Interquartile 25% (IQ1) | 84.5% | 69.7% |
| Interquartile 75% (IQ3) | 87.9% | 82.6% |
| Interquartile Range (IQR) | 3.4% | 12.9% |
| Standard Deviation (Sample) | 7.6% | 12.8% |
| Standard Deviation (Population) | 7.5% | 12.7% |
Similar Demographics by In Labor Force | Age 25-29
Demographics Similar to Immigrants from Nepal by In Labor Force | Age 25-29
In terms of in labor force | age 25-29, the demographic groups most similar to Immigrants from Nepal are Cypriot (85.8%, a difference of 0.0%), Lithuanian (85.8%, a difference of 0.010%), Polish (85.8%, a difference of 0.030%), Immigrants from Bulgaria (85.8%, a difference of 0.040%), and German Russian (85.8%, a difference of 0.050%).
| Demographics | Rating | Rank | In Labor Force | Age 25-29 |
| Immigrants | Liberia | 100.0 /100 | #29 | Exceptional 85.9% |
| Immigrants | Serbia | 100.0 /100 | #30 | Exceptional 85.9% |
| German Russians | 100.0 /100 | #31 | Exceptional 85.8% |
| Slovaks | 100.0 /100 | #32 | Exceptional 85.8% |
| Immigrants | Bulgaria | 100.0 /100 | #33 | Exceptional 85.8% |
| Lithuanians | 99.9 /100 | #34 | Exceptional 85.8% |
| Cypriots | 99.9 /100 | #35 | Exceptional 85.8% |
| Immigrants | Nepal | 99.9 /100 | #36 | Exceptional 85.8% |
| Poles | 99.9 /100 | #37 | Exceptional 85.8% |
| Sierra Leoneans | 99.9 /100 | #38 | Exceptional 85.8% |
| Croatians | 99.9 /100 | #39 | Exceptional 85.8% |
| Immigrants | Albania | 99.9 /100 | #40 | Exceptional 85.7% |
| Immigrants | Greece | 99.9 /100 | #41 | Exceptional 85.7% |
| Immigrants | Eritrea | 99.9 /100 | #42 | Exceptional 85.7% |
| Immigrants | India | 99.9 /100 | #43 | Exceptional 85.7% |
Demographics Similar to Choctaw by In Labor Force | Age 25-29
In terms of in labor force | age 25-29, the demographic groups most similar to Choctaw are Dutch West Indian (81.1%, a difference of 0.20%), Ute (80.8%, a difference of 0.20%), Houma (81.2%, a difference of 0.32%), Creek (80.7%, a difference of 0.35%), and Yakama (80.6%, a difference of 0.46%).
| Demographics | Rating | Rank | In Labor Force | Age 25-29 |
| Seminole | 0.0 /100 | #319 | Tragic 81.7% |
| Colville | 0.0 /100 | #320 | Tragic 81.6% |
| Shoshone | 0.0 /100 | #321 | Tragic 81.6% |
| Kiowa | 0.0 /100 | #322 | Tragic 81.6% |
| Alaska Natives | 0.0 /100 | #323 | Tragic 81.6% |
| Houma | 0.0 /100 | #324 | Tragic 81.2% |
| Dutch West Indians | 0.0 /100 | #325 | Tragic 81.1% |
| Choctaw | 0.0 /100 | #326 | Tragic 81.0% |
| Ute | 0.0 /100 | #327 | Tragic 80.8% |
| Creek | 0.0 /100 | #328 | Tragic 80.7% |
| Yakama | 0.0 /100 | #329 | Tragic 80.6% |
| Puerto Ricans | 0.0 /100 | #330 | Tragic 80.4% |
| Cheyenne | 0.0 /100 | #331 | Tragic 80.3% |
| Inupiat | 0.0 /100 | #332 | Tragic 79.8% |
| Sioux | 0.0 /100 | #333 | Tragic 79.7% |