Immigrants from Switzerland vs Immigrants from Lebanon In Labor Force | Age 25-29
COMPARE
Immigrants from Switzerland
Immigrants from Lebanon
In Labor Force | Age 25-29
In Labor Force | Age 25-29 Comparison
Immigrants from Switzerland
Immigrants from Lebanon
85.1%
IN LABOR FORCE | AGE 25-29
93.9/ 100
METRIC RATING
100th/ 347
METRIC RANK
83.4%
IN LABOR FORCE | AGE 25-29
0.0/ 100
METRIC RATING
268th/ 347
METRIC RANK
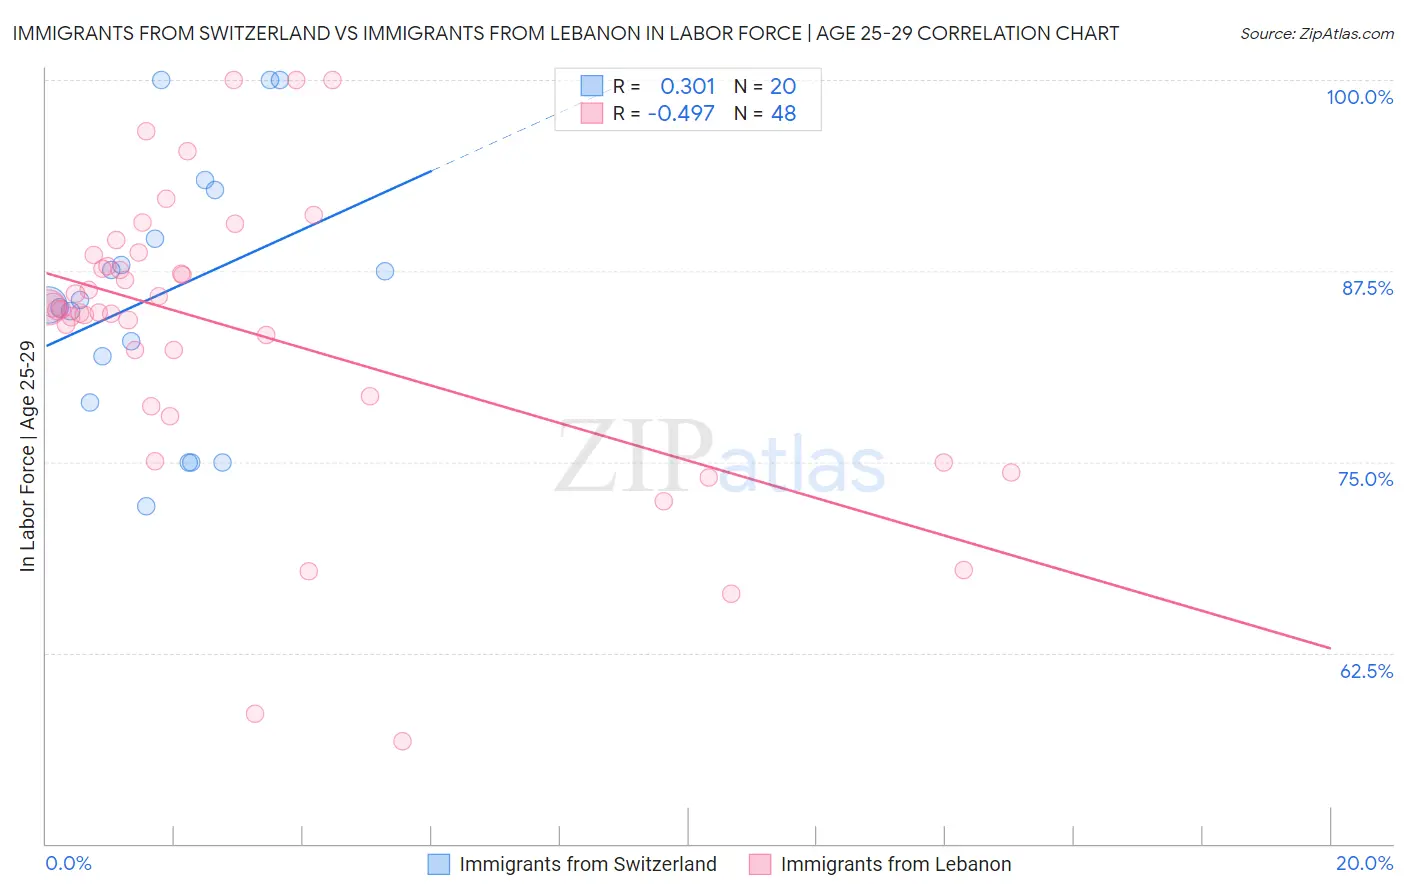
Immigrants from Switzerland vs Immigrants from Lebanon In Labor Force | Age 25-29 Correlation Chart
The statistical analysis conducted on geographies consisting of 148,053,964 people shows a mild positive correlation between the proportion of Immigrants from Switzerland and labor force participation rate among population between the ages 25 and 29 in the United States with a correlation coefficient (R) of 0.301 and weighted average of 85.1%. Similarly, the statistical analysis conducted on geographies consisting of 217,137,531 people shows a moderate negative correlation between the proportion of Immigrants from Lebanon and labor force participation rate among population between the ages 25 and 29 in the United States with a correlation coefficient (R) of -0.497 and weighted average of 83.4%, a difference of 2.0%.
In Labor Force | Age 25-29 Correlation Summary
| Measurement | Immigrants from Switzerland | Immigrants from Lebanon |
| Minimum | 72.1% | 56.7% |
| Maximum | 100.0% | 100.0% |
| Range | 27.9% | 43.3% |
| Mean | 86.0% | 83.5% |
| Median | 85.4% | 85.0% |
| Interquartile 25% (IQ1) | 80.4% | 79.0% |
| Interquartile 75% (IQ3) | 91.2% | 88.2% |
| Interquartile Range (IQR) | 10.8% | 9.2% |
| Standard Deviation (Sample) | 8.4% | 9.5% |
| Standard Deviation (Population) | 8.2% | 9.4% |
Similar Demographics by In Labor Force | Age 25-29
Demographics Similar to Immigrants from Switzerland by In Labor Force | Age 25-29
In terms of in labor force | age 25-29, the demographic groups most similar to Immigrants from Switzerland are Bangladeshi (85.1%, a difference of 0.0%), Egyptian (85.1%, a difference of 0.0%), Immigrants from Sudan (85.1%, a difference of 0.010%), Mongolian (85.1%, a difference of 0.010%), and Slavic (85.1%, a difference of 0.010%).
| Demographics | Rating | Rank | In Labor Force | Age 25-29 |
| Austrians | 95.3 /100 | #93 | Exceptional 85.1% |
| Immigrants | Korea | 94.8 /100 | #94 | Exceptional 85.1% |
| Immigrants | Netherlands | 94.6 /100 | #95 | Exceptional 85.1% |
| Immigrants | Romania | 94.6 /100 | #96 | Exceptional 85.1% |
| Immigrants | Sudan | 94.3 /100 | #97 | Exceptional 85.1% |
| Mongolians | 94.1 /100 | #98 | Exceptional 85.1% |
| Bangladeshis | 94.0 /100 | #99 | Exceptional 85.1% |
| Immigrants | Switzerland | 93.9 /100 | #100 | Exceptional 85.1% |
| Egyptians | 93.8 /100 | #101 | Exceptional 85.1% |
| Slavs | 93.7 /100 | #102 | Exceptional 85.1% |
| Immigrants | Japan | 93.5 /100 | #103 | Exceptional 85.1% |
| Immigrants | Zaire | 93.3 /100 | #104 | Exceptional 85.1% |
| Immigrants | Hong Kong | 92.8 /100 | #105 | Exceptional 85.0% |
| Czechoslovakians | 92.6 /100 | #106 | Exceptional 85.0% |
| Immigrants | Southern Europe | 92.3 /100 | #107 | Exceptional 85.0% |
Demographics Similar to Immigrants from Lebanon by In Labor Force | Age 25-29
In terms of in labor force | age 25-29, the demographic groups most similar to Immigrants from Lebanon are Immigrants from Barbados (83.4%, a difference of 0.0%), Spanish American (83.4%, a difference of 0.010%), Aleut (83.4%, a difference of 0.020%), Basque (83.4%, a difference of 0.020%), and Honduran (83.4%, a difference of 0.040%).
| Demographics | Rating | Rank | In Labor Force | Age 25-29 |
| Pennsylvania Germans | 0.1 /100 | #261 | Tragic 83.6% |
| Immigrants | Fiji | 0.1 /100 | #262 | Tragic 83.6% |
| West Indians | 0.1 /100 | #263 | Tragic 83.5% |
| Puget Sound Salish | 0.1 /100 | #264 | Tragic 83.5% |
| Cubans | 0.1 /100 | #265 | Tragic 83.5% |
| Aleuts | 0.0 /100 | #266 | Tragic 83.4% |
| Spanish Americans | 0.0 /100 | #267 | Tragic 83.4% |
| Immigrants | Lebanon | 0.0 /100 | #268 | Tragic 83.4% |
| Immigrants | Barbados | 0.0 /100 | #269 | Tragic 83.4% |
| Basques | 0.0 /100 | #270 | Tragic 83.4% |
| Hondurans | 0.0 /100 | #271 | Tragic 83.4% |
| Immigrants | Caribbean | 0.0 /100 | #272 | Tragic 83.4% |
| Immigrants | Dominica | 0.0 /100 | #273 | Tragic 83.4% |
| Marshallese | 0.0 /100 | #274 | Tragic 83.3% |
| Samoans | 0.0 /100 | #275 | Tragic 83.3% |