Immigrants from Sri Lanka vs Arapaho In Labor Force | Age 16-19
COMPARE
Immigrants from Sri Lanka
Arapaho
In Labor Force | Age 16-19
In Labor Force | Age 16-19 Comparison
Immigrants from Sri Lanka
Arapaho
34.9%
IN LABOR FORCE | AGE 16-19
2.4/ 100
METRIC RATING
246th/ 347
METRIC RANK
37.3%
IN LABOR FORCE | AGE 16-19
81.8/ 100
METRIC RATING
153rd/ 347
METRIC RANK
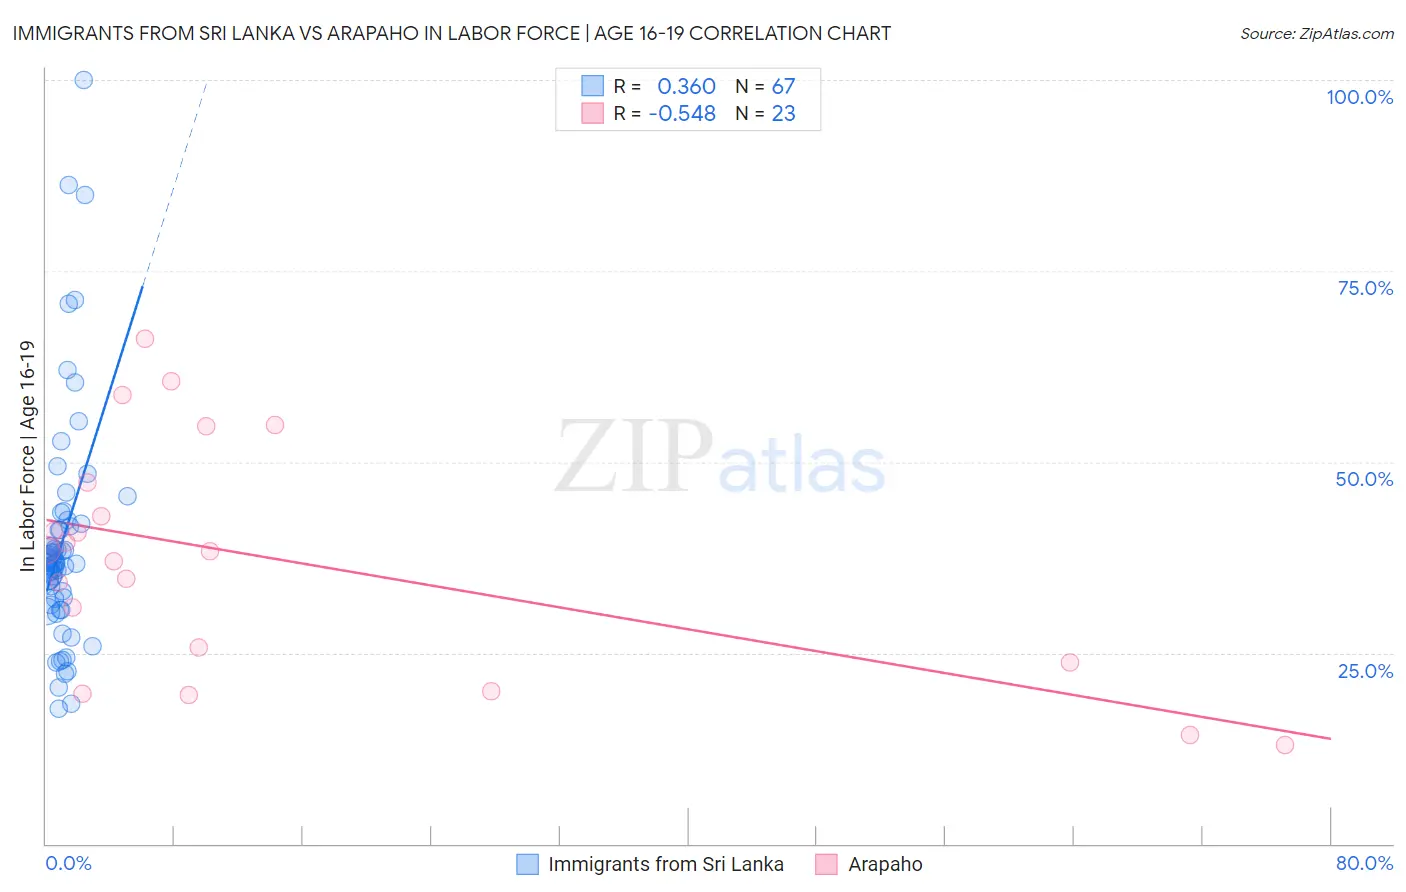
Immigrants from Sri Lanka vs Arapaho In Labor Force | Age 16-19 Correlation Chart
The statistical analysis conducted on geographies consisting of 149,654,702 people shows a mild positive correlation between the proportion of Immigrants from Sri Lanka and labor force participation rate among population between the ages 16 and 19 in the United States with a correlation coefficient (R) of 0.360 and weighted average of 34.9%. Similarly, the statistical analysis conducted on geographies consisting of 29,768,466 people shows a substantial negative correlation between the proportion of Arapaho and labor force participation rate among population between the ages 16 and 19 in the United States with a correlation coefficient (R) of -0.548 and weighted average of 37.3%, a difference of 6.9%.
In Labor Force | Age 16-19 Correlation Summary
| Measurement | Immigrants from Sri Lanka | Arapaho |
| Minimum | 17.6% | 13.0% |
| Maximum | 100.0% | 66.1% |
| Range | 82.4% | 53.1% |
| Mean | 39.5% | 37.2% |
| Median | 36.7% | 38.3% |
| Interquartile 25% (IQ1) | 31.2% | 23.7% |
| Interquartile 75% (IQ3) | 41.9% | 47.3% |
| Interquartile Range (IQR) | 10.7% | 23.6% |
| Standard Deviation (Sample) | 15.4% | 15.1% |
| Standard Deviation (Population) | 15.3% | 14.8% |
Similar Demographics by In Labor Force | Age 16-19
Demographics Similar to Immigrants from Sri Lanka by In Labor Force | Age 16-19
In terms of in labor force | age 16-19, the demographic groups most similar to Immigrants from Sri Lanka are Laotian (34.9%, a difference of 0.010%), Immigrants from Greece (34.9%, a difference of 0.020%), Immigrants from Turkey (34.9%, a difference of 0.080%), Central American (34.8%, a difference of 0.090%), and Pueblo (34.9%, a difference of 0.10%).
| Demographics | Rating | Rank | In Labor Force | Age 16-19 |
| Inupiat | 3.2 /100 | #239 | Tragic 35.0% |
| Immigrants | Central America | 3.0 /100 | #240 | Tragic 35.0% |
| Immigrants | Ireland | 2.9 /100 | #241 | Tragic 35.0% |
| Uruguayans | 2.6 /100 | #242 | Tragic 34.9% |
| Pueblo | 2.6 /100 | #243 | Tragic 34.9% |
| Immigrants | Turkey | 2.6 /100 | #244 | Tragic 34.9% |
| Immigrants | Greece | 2.4 /100 | #245 | Tragic 34.9% |
| Immigrants | Sri Lanka | 2.4 /100 | #246 | Tragic 34.9% |
| Laotians | 2.4 /100 | #247 | Tragic 34.9% |
| Central Americans | 2.2 /100 | #248 | Tragic 34.8% |
| Immigrants | Ukraine | 2.2 /100 | #249 | Tragic 34.8% |
| Immigrants | Pakistan | 2.0 /100 | #250 | Tragic 34.8% |
| Immigrants | Western Asia | 2.0 /100 | #251 | Tragic 34.8% |
| Immigrants | Chile | 2.0 /100 | #252 | Tragic 34.8% |
| Immigrants | Japan | 1.5 /100 | #253 | Tragic 34.7% |
Demographics Similar to Arapaho by In Labor Force | Age 16-19
In terms of in labor force | age 16-19, the demographic groups most similar to Arapaho are Immigrants from Bulgaria (37.3%, a difference of 0.020%), Immigrants from Lithuania (37.2%, a difference of 0.090%), Kiowa (37.2%, a difference of 0.12%), Immigrants from Sierra Leone (37.3%, a difference of 0.15%), and Immigrants from Poland (37.3%, a difference of 0.23%).
| Demographics | Rating | Rank | In Labor Force | Age 16-19 |
| Immigrants | Western Europe | 88.9 /100 | #146 | Excellent 37.5% |
| Brazilians | 88.7 /100 | #147 | Excellent 37.5% |
| Romanians | 87.3 /100 | #148 | Excellent 37.5% |
| Native Hawaiians | 85.0 /100 | #149 | Excellent 37.4% |
| Tsimshian | 84.7 /100 | #150 | Excellent 37.4% |
| Immigrants | Poland | 84.4 /100 | #151 | Excellent 37.3% |
| Immigrants | Sierra Leone | 83.6 /100 | #152 | Excellent 37.3% |
| Arapaho | 81.8 /100 | #153 | Excellent 37.3% |
| Immigrants | Bulgaria | 81.6 /100 | #154 | Excellent 37.3% |
| Immigrants | Lithuania | 80.7 /100 | #155 | Excellent 37.2% |
| Kiowa | 80.4 /100 | #156 | Excellent 37.2% |
| Immigrants | Brazil | 76.5 /100 | #157 | Good 37.1% |
| Ute | 75.7 /100 | #158 | Good 37.1% |
| Yaqui | 74.4 /100 | #159 | Good 37.1% |
| Immigrants | Saudi Arabia | 73.9 /100 | #160 | Good 37.0% |