Croatian vs Arapaho In Labor Force | Age 16-19
COMPARE
Croatian
Arapaho
In Labor Force | Age 16-19
In Labor Force | Age 16-19 Comparison
Croatians
Arapaho
41.1%
IN LABOR FORCE | AGE 16-19
100.0/ 100
METRIC RATING
45th/ 347
METRIC RANK
37.3%
IN LABOR FORCE | AGE 16-19
81.8/ 100
METRIC RATING
153rd/ 347
METRIC RANK
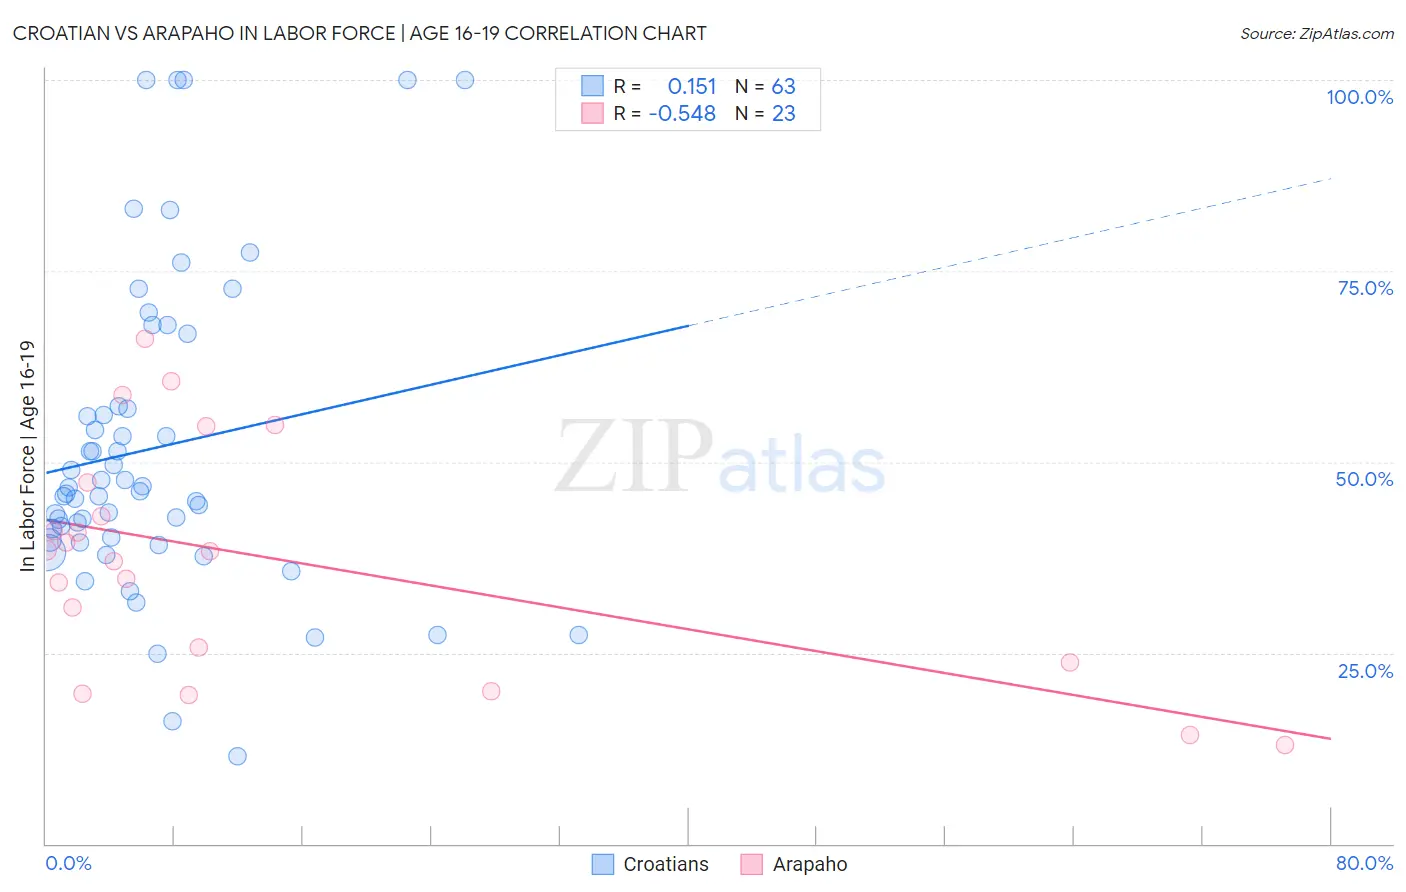
Croatian vs Arapaho In Labor Force | Age 16-19 Correlation Chart
The statistical analysis conducted on geographies consisting of 375,104,825 people shows a poor positive correlation between the proportion of Croatians and labor force participation rate among population between the ages 16 and 19 in the United States with a correlation coefficient (R) of 0.151 and weighted average of 41.1%. Similarly, the statistical analysis conducted on geographies consisting of 29,768,466 people shows a substantial negative correlation between the proportion of Arapaho and labor force participation rate among population between the ages 16 and 19 in the United States with a correlation coefficient (R) of -0.548 and weighted average of 37.3%, a difference of 10.4%.
In Labor Force | Age 16-19 Correlation Summary
| Measurement | Croatian | Arapaho |
| Minimum | 11.5% | 13.0% |
| Maximum | 100.0% | 66.1% |
| Range | 88.5% | 53.1% |
| Mean | 51.8% | 37.2% |
| Median | 46.2% | 38.3% |
| Interquartile 25% (IQ1) | 39.8% | 23.7% |
| Interquartile 75% (IQ3) | 57.3% | 47.3% |
| Interquartile Range (IQR) | 17.4% | 23.6% |
| Standard Deviation (Sample) | 20.4% | 15.1% |
| Standard Deviation (Population) | 20.3% | 14.8% |
Similar Demographics by In Labor Force | Age 16-19
Demographics Similar to Croatians by In Labor Force | Age 16-19
In terms of in labor force | age 16-19, the demographic groups most similar to Croatians are European (41.1%, a difference of 0.040%), Tongan (41.2%, a difference of 0.14%), Immigrants from Sudan (41.0%, a difference of 0.32%), Celtic (41.3%, a difference of 0.45%), and White/Caucasian (41.3%, a difference of 0.45%).
| Demographics | Rating | Rank | In Labor Force | Age 16-19 |
| Sioux | 100.0 /100 | #38 | Exceptional 41.5% |
| Scotch-Irish | 100.0 /100 | #39 | Exceptional 41.5% |
| Immigrants | Liberia | 100.0 /100 | #40 | Exceptional 41.5% |
| Celtics | 100.0 /100 | #41 | Exceptional 41.3% |
| Whites/Caucasians | 100.0 /100 | #42 | Exceptional 41.3% |
| Tongans | 100.0 /100 | #43 | Exceptional 41.2% |
| Europeans | 100.0 /100 | #44 | Exceptional 41.1% |
| Croatians | 100.0 /100 | #45 | Exceptional 41.1% |
| Immigrants | Sudan | 100.0 /100 | #46 | Exceptional 41.0% |
| Carpatho Rusyns | 100.0 /100 | #47 | Exceptional 40.8% |
| Icelanders | 100.0 /100 | #48 | Exceptional 40.8% |
| Cree | 100.0 /100 | #49 | Exceptional 40.8% |
| Indonesians | 100.0 /100 | #50 | Exceptional 40.7% |
| Immigrants | Zaire | 100.0 /100 | #51 | Exceptional 40.7% |
| Immigrants | Laos | 100.0 /100 | #52 | Exceptional 40.6% |
Demographics Similar to Arapaho by In Labor Force | Age 16-19
In terms of in labor force | age 16-19, the demographic groups most similar to Arapaho are Immigrants from Bulgaria (37.3%, a difference of 0.020%), Immigrants from Lithuania (37.2%, a difference of 0.090%), Kiowa (37.2%, a difference of 0.12%), Immigrants from Sierra Leone (37.3%, a difference of 0.15%), and Immigrants from Poland (37.3%, a difference of 0.23%).
| Demographics | Rating | Rank | In Labor Force | Age 16-19 |
| Immigrants | Western Europe | 88.9 /100 | #146 | Excellent 37.5% |
| Brazilians | 88.7 /100 | #147 | Excellent 37.5% |
| Romanians | 87.3 /100 | #148 | Excellent 37.5% |
| Native Hawaiians | 85.0 /100 | #149 | Excellent 37.4% |
| Tsimshian | 84.7 /100 | #150 | Excellent 37.4% |
| Immigrants | Poland | 84.4 /100 | #151 | Excellent 37.3% |
| Immigrants | Sierra Leone | 83.6 /100 | #152 | Excellent 37.3% |
| Arapaho | 81.8 /100 | #153 | Excellent 37.3% |
| Immigrants | Bulgaria | 81.6 /100 | #154 | Excellent 37.3% |
| Immigrants | Lithuania | 80.7 /100 | #155 | Excellent 37.2% |
| Kiowa | 80.4 /100 | #156 | Excellent 37.2% |
| Immigrants | Brazil | 76.5 /100 | #157 | Good 37.1% |
| Ute | 75.7 /100 | #158 | Good 37.1% |
| Yaqui | 74.4 /100 | #159 | Good 37.1% |
| Immigrants | Saudi Arabia | 73.9 /100 | #160 | Good 37.0% |