Immigrants from South Eastern Asia vs Cambodian In Labor Force | Age 30-34
COMPARE
Immigrants from South Eastern Asia
Cambodian
In Labor Force | Age 30-34
In Labor Force | Age 30-34 Comparison
Immigrants from South Eastern Asia
Cambodians
84.7%
IN LABOR FORCE | AGE 30-34
54.2/ 100
METRIC RATING
167th/ 347
METRIC RANK
86.2%
IN LABOR FORCE | AGE 30-34
100.0/ 100
METRIC RATING
8th/ 347
METRIC RANK
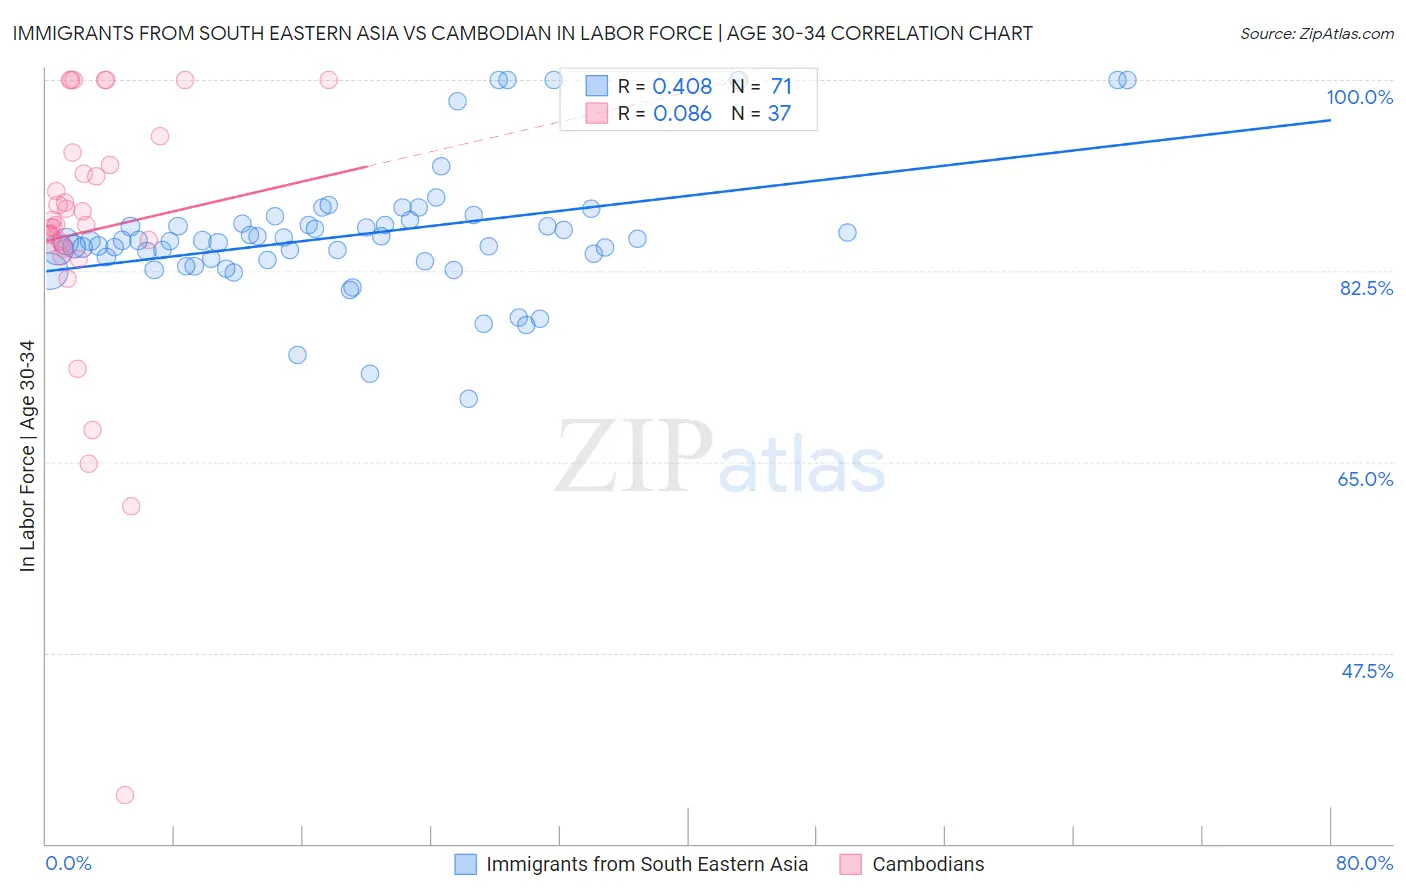
Immigrants from South Eastern Asia vs Cambodian In Labor Force | Age 30-34 Correlation Chart
The statistical analysis conducted on geographies consisting of 512,225,276 people shows a moderate positive correlation between the proportion of Immigrants from South Eastern Asia and labor force participation rate among population between the ages 30 and 34 in the United States with a correlation coefficient (R) of 0.408 and weighted average of 84.7%. Similarly, the statistical analysis conducted on geographies consisting of 102,502,292 people shows a slight positive correlation between the proportion of Cambodians and labor force participation rate among population between the ages 30 and 34 in the United States with a correlation coefficient (R) of 0.086 and weighted average of 86.2%, a difference of 1.8%.
In Labor Force | Age 30-34 Correlation Summary
| Measurement | Immigrants from South Eastern Asia | Cambodian |
| Minimum | 70.7% | 34.5% |
| Maximum | 100.0% | 100.0% |
| Range | 29.3% | 65.5% |
| Mean | 85.8% | 86.2% |
| Median | 85.2% | 86.8% |
| Interquartile 25% (IQ1) | 83.5% | 84.7% |
| Interquartile 75% (IQ3) | 86.9% | 92.8% |
| Interquartile Range (IQR) | 3.4% | 8.1% |
| Standard Deviation (Sample) | 5.8% | 12.8% |
| Standard Deviation (Population) | 5.8% | 12.6% |
Similar Demographics by In Labor Force | Age 30-34
Demographics Similar to Immigrants from South Eastern Asia by In Labor Force | Age 30-34
In terms of in labor force | age 30-34, the demographic groups most similar to Immigrants from South Eastern Asia are Afghan (84.7%, a difference of 0.010%), Immigrants from Peru (84.7%, a difference of 0.010%), South American Indian (84.7%, a difference of 0.010%), Immigrants from Uruguay (84.7%, a difference of 0.020%), and Icelander (84.7%, a difference of 0.020%).
| Demographics | Rating | Rank | In Labor Force | Age 30-34 |
| Pakistanis | 60.8 /100 | #160 | Good 84.7% |
| Immigrants | Cambodia | 60.7 /100 | #161 | Good 84.7% |
| South Americans | 58.7 /100 | #162 | Average 84.7% |
| Immigrants | Uruguay | 57.4 /100 | #163 | Average 84.7% |
| Icelanders | 56.8 /100 | #164 | Average 84.7% |
| Immigrants | Western Europe | 56.7 /100 | #165 | Average 84.7% |
| Afghans | 55.2 /100 | #166 | Average 84.7% |
| Immigrants | South Eastern Asia | 54.2 /100 | #167 | Average 84.7% |
| Immigrants | Peru | 52.4 /100 | #168 | Average 84.7% |
| South American Indians | 52.1 /100 | #169 | Average 84.7% |
| Immigrants | Burma/Myanmar | 52.0 /100 | #170 | Average 84.7% |
| Irish | 52.0 /100 | #171 | Average 84.7% |
| Immigrants | England | 51.7 /100 | #172 | Average 84.7% |
| Israelis | 51.1 /100 | #173 | Average 84.7% |
| Finns | 50.0 /100 | #174 | Average 84.7% |
Demographics Similar to Cambodians by In Labor Force | Age 30-34
In terms of in labor force | age 30-34, the demographic groups most similar to Cambodians are Immigrants from Bolivia (86.2%, a difference of 0.010%), Immigrants from Somalia (86.2%, a difference of 0.010%), Somali (86.2%, a difference of 0.020%), Immigrants from Serbia (86.2%, a difference of 0.050%), and Immigrants from Ireland (86.3%, a difference of 0.060%).
| Demographics | Rating | Rank | In Labor Force | Age 30-34 |
| Luxembourgers | 100.0 /100 | #1 | Exceptional 86.6% |
| Ethiopians | 100.0 /100 | #2 | Exceptional 86.6% |
| Immigrants | Ethiopia | 100.0 /100 | #3 | Exceptional 86.6% |
| Liberians | 100.0 /100 | #4 | Exceptional 86.4% |
| Immigrants | Ireland | 100.0 /100 | #5 | Exceptional 86.3% |
| Somalis | 100.0 /100 | #6 | Exceptional 86.2% |
| Immigrants | Bolivia | 100.0 /100 | #7 | Exceptional 86.2% |
| Cambodians | 100.0 /100 | #8 | Exceptional 86.2% |
| Immigrants | Somalia | 100.0 /100 | #9 | Exceptional 86.2% |
| Immigrants | Serbia | 100.0 /100 | #10 | Exceptional 86.2% |
| Carpatho Rusyns | 100.0 /100 | #11 | Exceptional 86.2% |
| Bolivians | 100.0 /100 | #12 | Exceptional 86.1% |
| Immigrants | Croatia | 100.0 /100 | #13 | Exceptional 86.1% |
| Immigrants | Cabo Verde | 100.0 /100 | #14 | Exceptional 86.1% |
| Immigrants | Albania | 100.0 /100 | #15 | Exceptional 86.1% |