Immigrants from South Africa vs Ghanaian In Labor Force | Age > 16
COMPARE
Immigrants from South Africa
Ghanaian
In Labor Force | Age > 16
In Labor Force | Age > 16 Comparison
Immigrants from South Africa
Ghanaians
65.3%
IN LABOR FORCE | AGE > 16
73.5/ 100
METRIC RATING
160th/ 347
METRIC RANK
67.1%
IN LABOR FORCE | AGE > 16
100.0/ 100
METRIC RATING
31st/ 347
METRIC RANK
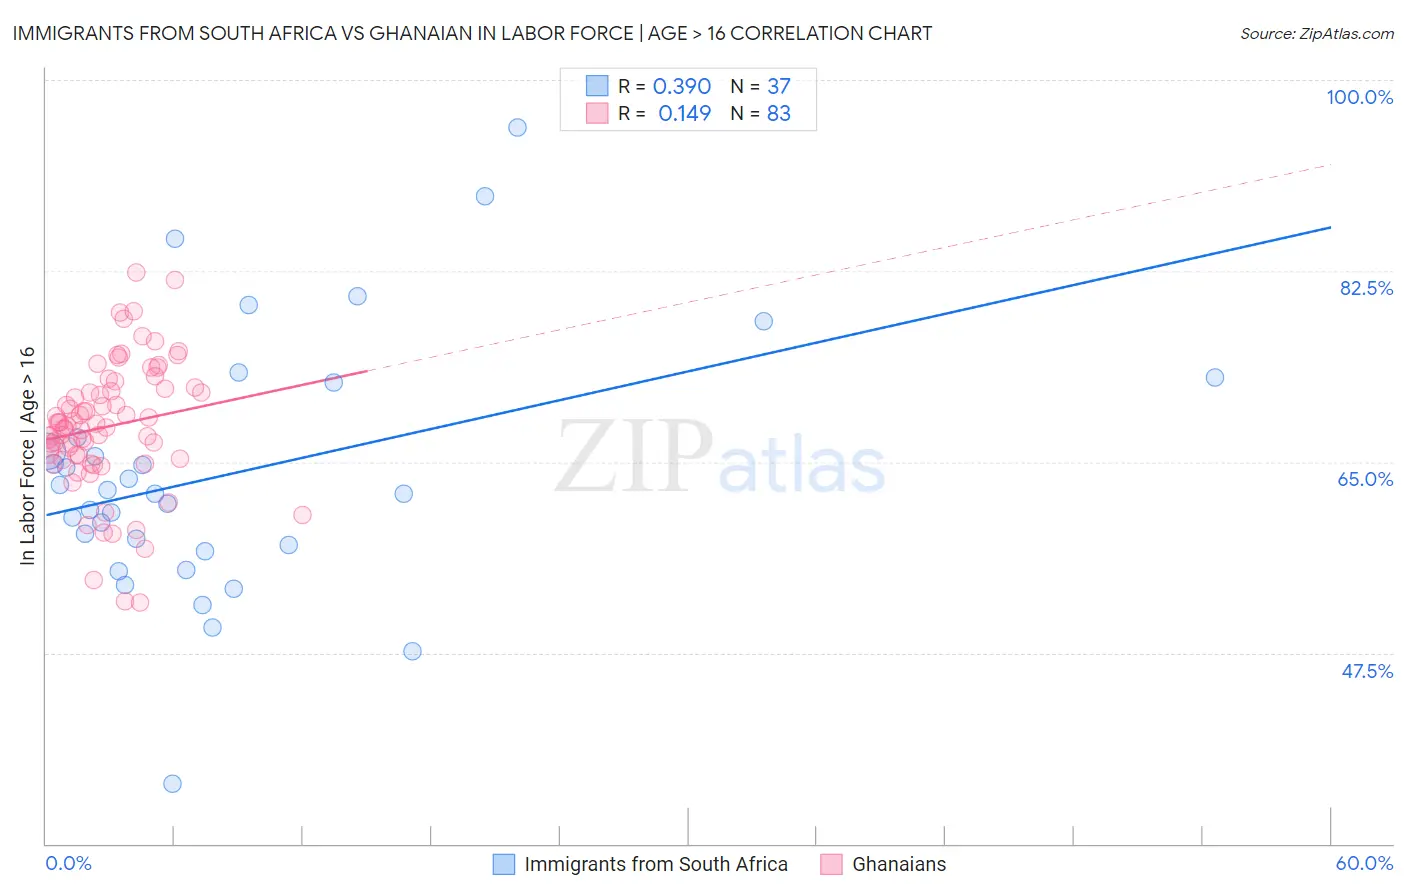
Immigrants from South Africa vs Ghanaian In Labor Force | Age > 16 Correlation Chart
The statistical analysis conducted on geographies consisting of 233,322,326 people shows a mild positive correlation between the proportion of Immigrants from South Africa and labor force participation rate among population ages 16 and over in the United States with a correlation coefficient (R) of 0.390 and weighted average of 65.3%. Similarly, the statistical analysis conducted on geographies consisting of 190,727,867 people shows a poor positive correlation between the proportion of Ghanaians and labor force participation rate among population ages 16 and over in the United States with a correlation coefficient (R) of 0.149 and weighted average of 67.1%, a difference of 2.8%.
In Labor Force | Age > 16 Correlation Summary
| Measurement | Immigrants from South Africa | Ghanaian |
| Minimum | 35.5% | 52.1% |
| Maximum | 95.6% | 82.4% |
| Range | 60.1% | 30.3% |
| Mean | 63.9% | 68.2% |
| Median | 62.1% | 68.3% |
| Interquartile 25% (IQ1) | 57.1% | 65.3% |
| Interquartile 75% (IQ3) | 69.8% | 71.7% |
| Interquartile Range (IQR) | 12.7% | 6.4% |
| Standard Deviation (Sample) | 11.9% | 5.9% |
| Standard Deviation (Population) | 11.7% | 5.9% |
Similar Demographics by In Labor Force | Age > 16
Demographics Similar to Immigrants from South Africa by In Labor Force | Age > 16
In terms of in labor force | age > 16, the demographic groups most similar to Immigrants from South Africa are Immigrants from Syria (65.3%, a difference of 0.020%), Immigrants from Russia (65.3%, a difference of 0.030%), Panamanian (65.3%, a difference of 0.030%), Australian (65.3%, a difference of 0.030%), and Immigrants from Ireland (65.3%, a difference of 0.040%).
| Demographics | Rating | Rank | In Labor Force | Age > 16 |
| Immigrants | China | 80.5 /100 | #153 | Excellent 65.4% |
| Immigrants | Eastern Europe | 78.3 /100 | #154 | Good 65.4% |
| Immigrants | Armenia | 76.6 /100 | #155 | Good 65.3% |
| Immigrants | Ireland | 75.9 /100 | #156 | Good 65.3% |
| Immigrants | Russia | 75.7 /100 | #157 | Good 65.3% |
| Panamanians | 75.2 /100 | #158 | Good 65.3% |
| Immigrants | Syria | 74.6 /100 | #159 | Good 65.3% |
| Immigrants | South Africa | 73.5 /100 | #160 | Good 65.3% |
| Australians | 71.3 /100 | #161 | Good 65.3% |
| Albanians | 70.8 /100 | #162 | Good 65.3% |
| South Africans | 69.8 /100 | #163 | Good 65.3% |
| Danes | 68.8 /100 | #164 | Good 65.3% |
| Immigrants | Kazakhstan | 68.1 /100 | #165 | Good 65.3% |
| Immigrants | Western Asia | 67.3 /100 | #166 | Good 65.3% |
| Immigrants | Belarus | 66.0 /100 | #167 | Good 65.2% |
Demographics Similar to Ghanaians by In Labor Force | Age > 16
In terms of in labor force | age > 16, the demographic groups most similar to Ghanaians are Immigrants from Congo (67.1%, a difference of 0.060%), Afghan (67.1%, a difference of 0.060%), Immigrants from Ghana (67.1%, a difference of 0.070%), Immigrants from Zaire (67.2%, a difference of 0.10%), and Thai (67.2%, a difference of 0.11%).
| Demographics | Rating | Rank | In Labor Force | Age > 16 |
| Ugandans | 100.0 /100 | #24 | Exceptional 67.4% |
| Immigrants | Africa | 100.0 /100 | #25 | Exceptional 67.4% |
| Immigrants | Cabo Verde | 100.0 /100 | #26 | Exceptional 67.3% |
| Zimbabweans | 100.0 /100 | #27 | Exceptional 67.3% |
| Immigrants | Morocco | 100.0 /100 | #28 | Exceptional 67.2% |
| Thais | 100.0 /100 | #29 | Exceptional 67.2% |
| Immigrants | Zaire | 100.0 /100 | #30 | Exceptional 67.2% |
| Ghanaians | 100.0 /100 | #31 | Exceptional 67.1% |
| Immigrants | Congo | 100.0 /100 | #32 | Exceptional 67.1% |
| Afghans | 100.0 /100 | #33 | Exceptional 67.1% |
| Immigrants | Ghana | 100.0 /100 | #34 | Exceptional 67.1% |
| Immigrants | South Central Asia | 100.0 /100 | #35 | Exceptional 67.1% |
| Immigrants | Western Africa | 100.0 /100 | #36 | Exceptional 67.1% |
| Immigrants | Afghanistan | 100.0 /100 | #37 | Exceptional 67.0% |
| Immigrants | Nigeria | 100.0 /100 | #38 | Exceptional 66.9% |